Fig. 18.
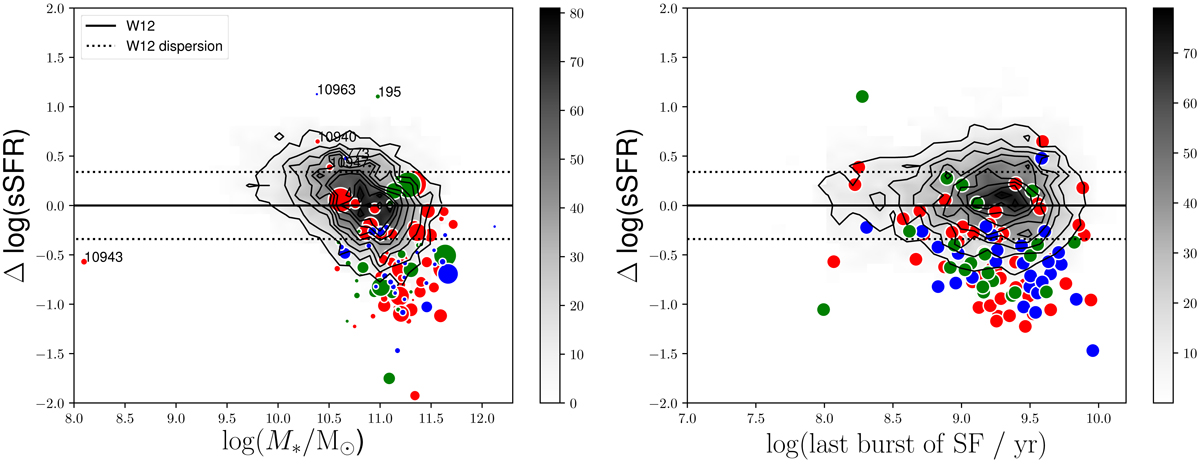
Left: ΔsSFR, the difference between specific SFR and the specific SFR of objects in the MS, as a function of stellar mass for the FR objects, shown in colour, compared to the pure SFGs at 3 GHz (Smolčić et al. 2017b), shown in black as density plot. For FR objects, symbols are scaled based on their linear projected size. Larger symbols correspond to larger objects. FRIIs are shown in red, FRI/FRIIs in green and FRIs in blue. The solid and dotted lines show the main sequence for star forming galaxies and spread, based on Whitaker et al. (2012). Right: ΔsSFR, as on the left, vs. the star-formation history (SFH) of each object. The SFHs are estimated from the fit to the SED as described in Sect. 3.3.1. We exclude COM AGN objects from these plots for clarity. COM AGN are shown in Fig. 11.
Current usage metrics show cumulative count of Article Views (full-text article views including HTML views, PDF and ePub downloads, according to the available data) and Abstracts Views on Vision4Press platform.
Data correspond to usage on the plateform after 2015. The current usage metrics is available 48-96 hours after online publication and is updated daily on week days.
Initial download of the metrics may take a while.