Fig. 15.
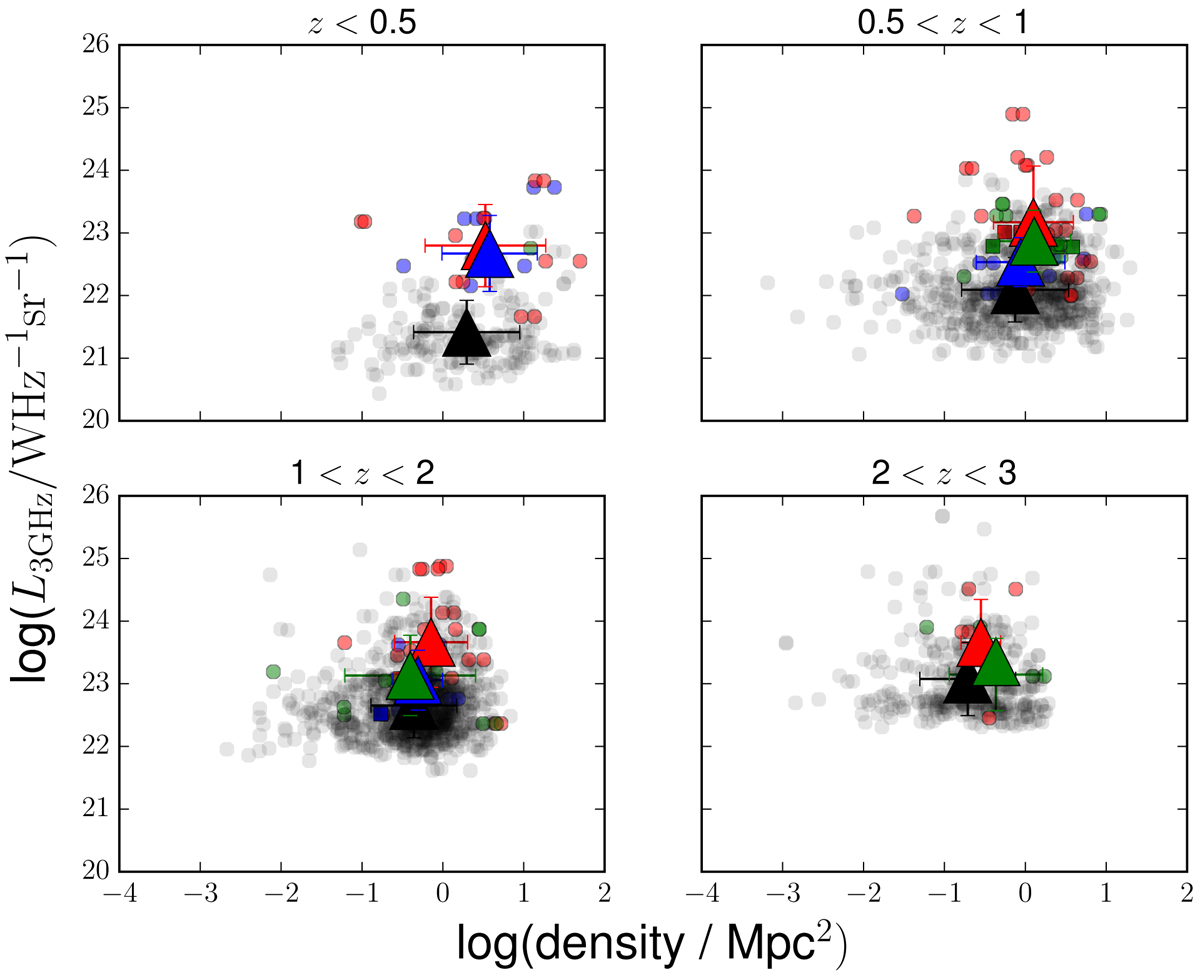
Radio luminosity at 3 GHz vs. number density per Mpc2 of galaxies in COSMOS, in four redshift bins. The density fields are from Scoville et al. (2013). Symbols are the same as in Fig. 4. Circles are objects with radio excess, and squares are objects without radio excess (Delvecchio et al. 2017). The mean values are given by large triangles, along with their standard deviations for the FRIIs (red), FRIs (blue), FRI/FRIIs (green), and COM AGN (black). The bins are selected for a comparison with the literature.
Current usage metrics show cumulative count of Article Views (full-text article views including HTML views, PDF and ePub downloads, according to the available data) and Abstracts Views on Vision4Press platform.
Data correspond to usage on the plateform after 2015. The current usage metrics is available 48-96 hours after online publication and is updated daily on week days.
Initial download of the metrics may take a while.