Fig. 14.
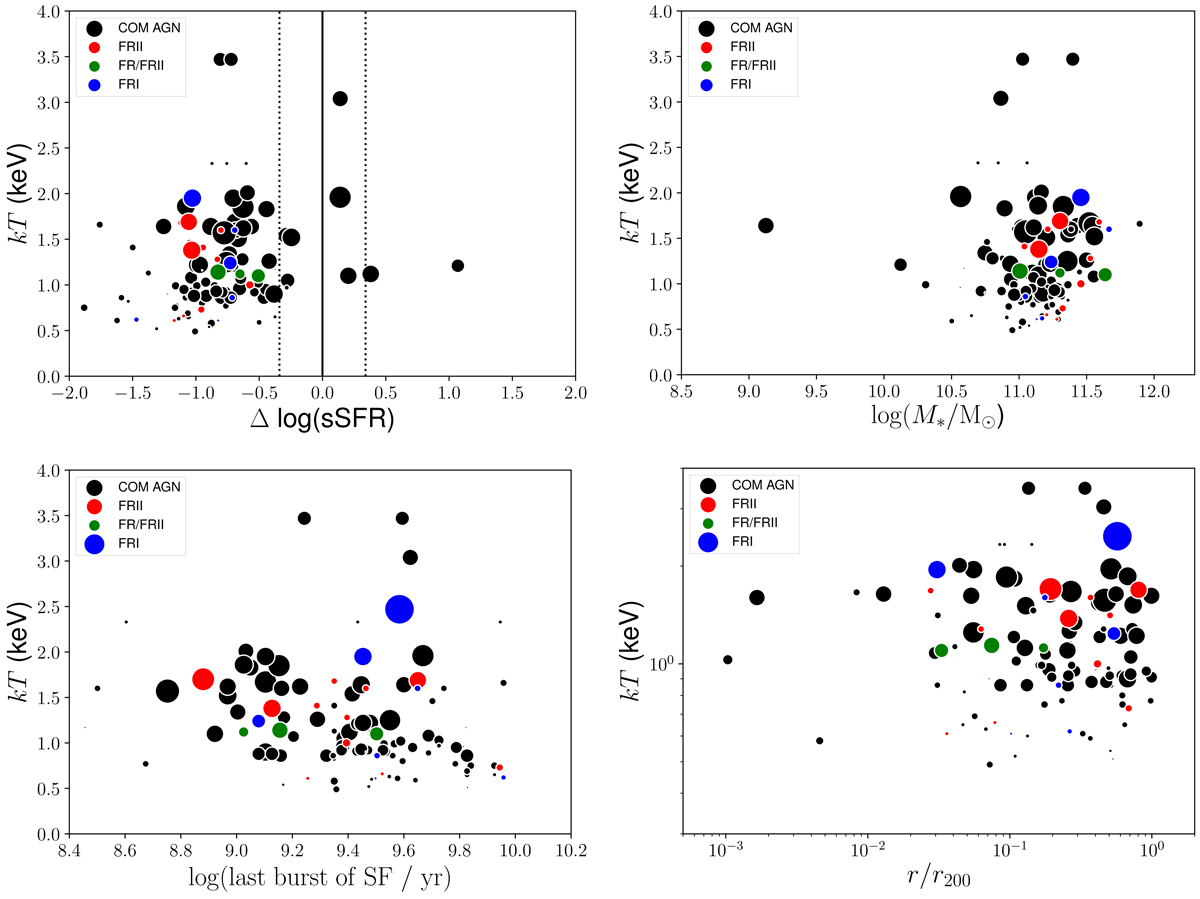
Top left: IGM temperature kT of the X-ray group in keV vs. ΔsSFR for the FRs and COM AGN that lie within the X-ray groups (0.08 ≤ z < 1.53) in the COSMOS field (Gozaliasl et al. 2019). The solid and dotted lines show the main sequence for star-forming galaxies and spread based on Whitaker et al. (2012). Top right: IGM temperature kT of the X-ray group in keV vs. M* of the FRs and COM AGN that lie within the X-ray groups. Colours: red for FRIIs, blue for FRIs, green for FRI/FRIIs and black for COM AGN. Bottom left: IGM temperature in keV vs. last burst of star formation. Bottom right: IGM temperature in keV vs. distance of FR or COM AGN from X-ray group centre, normalised to the virial radius r200. Typical errors on the temperatures are 20%. In all plots the symbol size is proportional to redshift (symbol size increases with redshift). Red symbols denote FRII, green symbols show FRI/FRII, blue symbols are for FRI, and black symbols denote COM AGN. The median IGM temperature corresponding to FRs and COM AGN is 1.16 ± 0.46 and 1.04 ± 0.59, respectively.
Current usage metrics show cumulative count of Article Views (full-text article views including HTML views, PDF and ePub downloads, according to the available data) and Abstracts Views on Vision4Press platform.
Data correspond to usage on the plateform after 2015. The current usage metrics is available 48-96 hours after online publication and is updated daily on week days.
Initial download of the metrics may take a while.