Fig. 13.
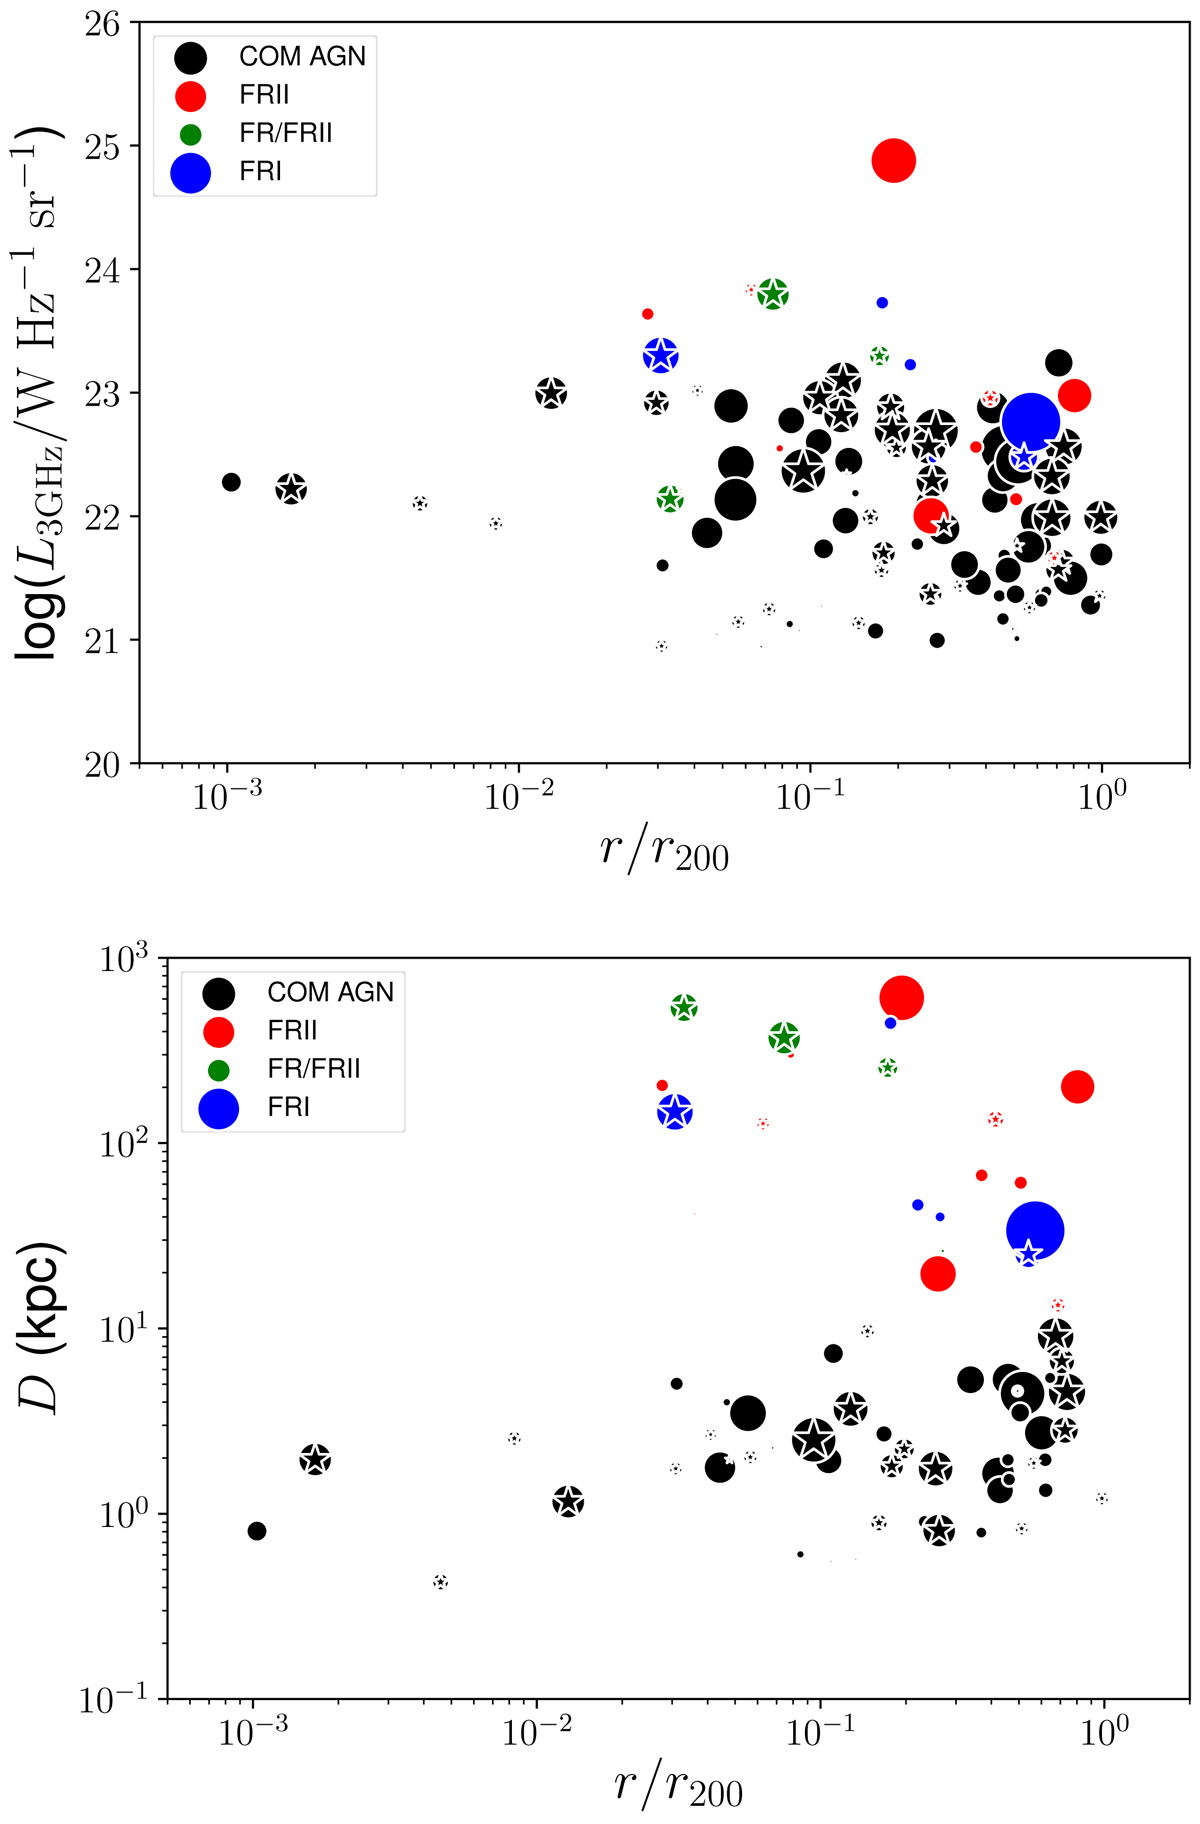
Top: radio luminosity at 3 GHz for the galaxies that lie within the X-ray groups in the COSMOS field (Gozaliasl et al. 2019) vs. their distance from the group centre, normalised by the virial radius r200, for 0.08 ≤ z < 1.53. Bottom: linear projected size D as in Table C.1 vs. distance from the group centre normalised to the virial radius for the same redshift bins as in the panel above. Red colour denotes FRIIs, blue is for FRIs, green denotes FRI/FRIIs, and black is for COM AGN. In both plots the symbol size is proportional to redshift (larger the symbol, larger the redshift). Stars highlight sources that are the brightest group galaxy.
Current usage metrics show cumulative count of Article Views (full-text article views including HTML views, PDF and ePub downloads, according to the available data) and Abstracts Views on Vision4Press platform.
Data correspond to usage on the plateform after 2015. The current usage metrics is available 48-96 hours after online publication and is updated daily on week days.
Initial download of the metrics may take a while.