Fig. 11.
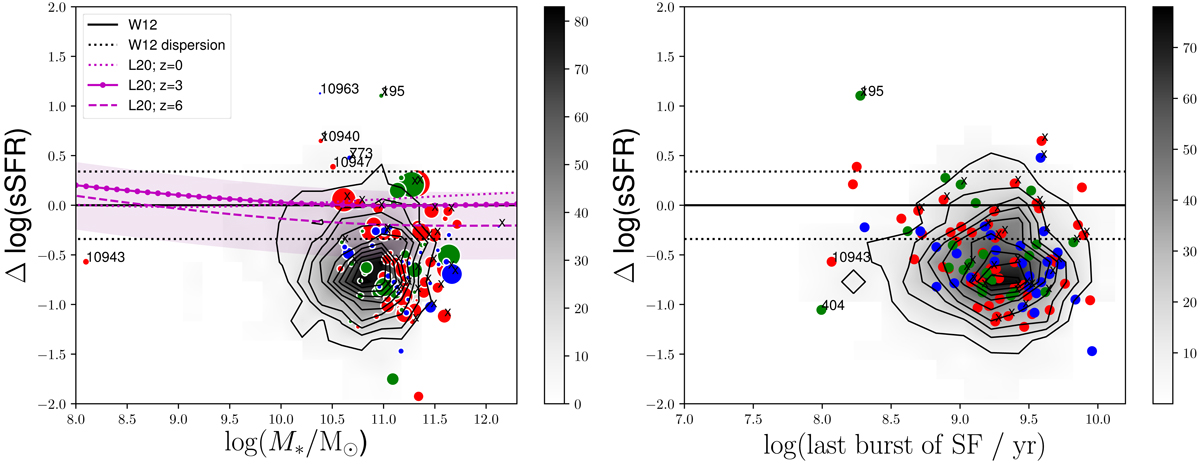
Left: ΔsSFR, the difference between specific SFR and the specific SFR of objects in the MS, as a function of stellar mass for the four populations of radio AGN presented in this paper. For FR objects, the symbols are scaled based on their linear projected size, with larger symbols corresponding to larger objects. The jet-less COM AGN are shown in black as a density plot. The solid and dotted lines show the main sequence for star-forming galaxies and spread, based on Whitaker et al. (2012). We also show in purple the Leslie et al. (2020) SFR–M* relation relative to the Whitaker et al. (2012) MS relation for z = 0 (dotted purple line), z = 3 (dotted-dashed purple line) and z = 6 (dashed purple line) along with the dispersion. The diversion from the Whitaker et al. (2012) MS is insignificant for massive galaxies (1010.5−11.5). Right: ΔsSFR, as on the left, vs. the star-formation history (SFH) of each object. SFHs are estimated from a fit to the SED as described in Sect. 2.2. Median values are shown in Table 3. In both plots an x marks objects that have an X-ray detection based on the catalogue of Marchesi et al. (2016).
Current usage metrics show cumulative count of Article Views (full-text article views including HTML views, PDF and ePub downloads, according to the available data) and Abstracts Views on Vision4Press platform.
Data correspond to usage on the plateform after 2015. The current usage metrics is available 48-96 hours after online publication and is updated daily on week days.
Initial download of the metrics may take a while.