Fig. 10.
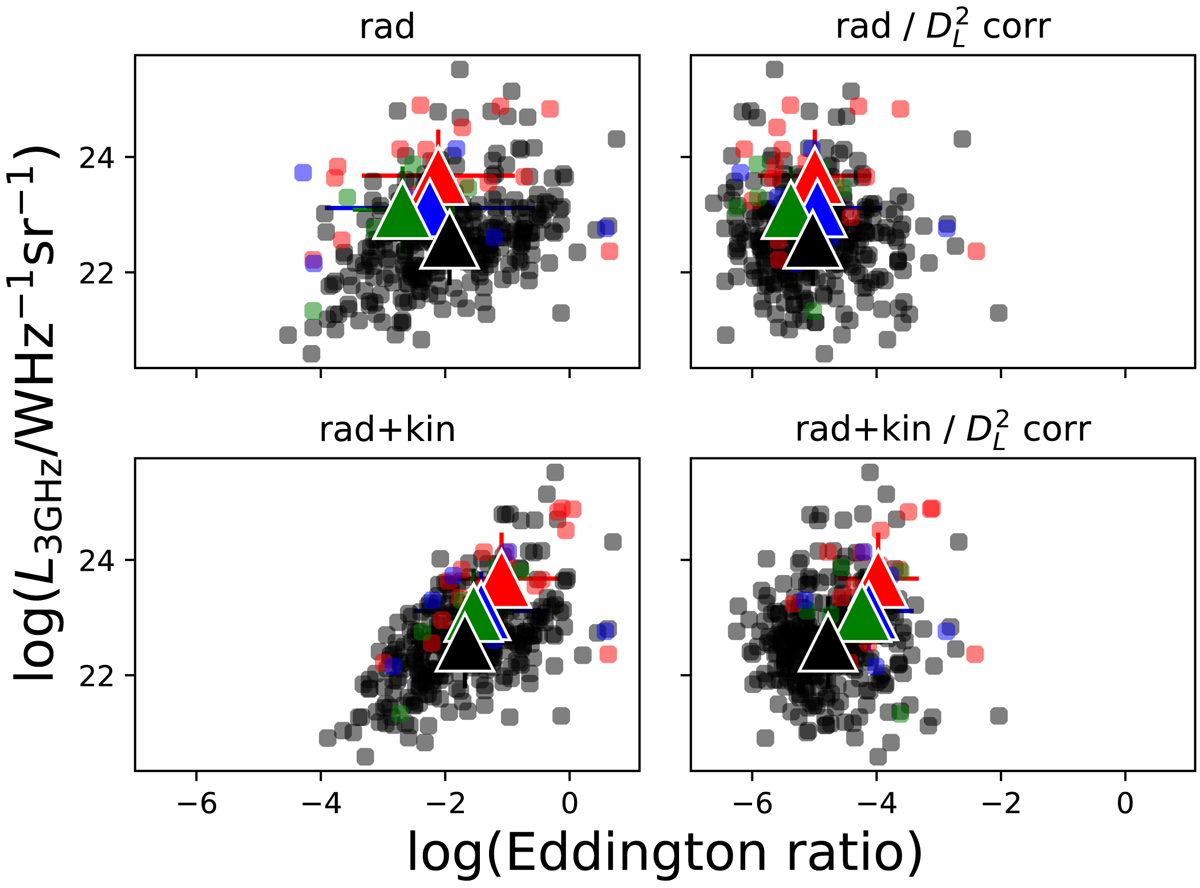
Radio power at 3 GHz vs. Eddington ratio, radiative (top panels) and kinetic (bottom panels), for ![]() uncorrected (left panels) and corrected values (right panels). FRII are shown in red, are shown in FRI blue, FRI/FRII are shown in green, and COM AGN are shown in black. Mean values and standard deviations are shown as large triangles, colour-coded based on the radio class.
uncorrected (left panels) and corrected values (right panels). FRII are shown in red, are shown in FRI blue, FRI/FRII are shown in green, and COM AGN are shown in black. Mean values and standard deviations are shown as large triangles, colour-coded based on the radio class.
Current usage metrics show cumulative count of Article Views (full-text article views including HTML views, PDF and ePub downloads, according to the available data) and Abstracts Views on Vision4Press platform.
Data correspond to usage on the plateform after 2015. The current usage metrics is available 48-96 hours after online publication and is updated daily on week days.
Initial download of the metrics may take a while.