Fig. 7
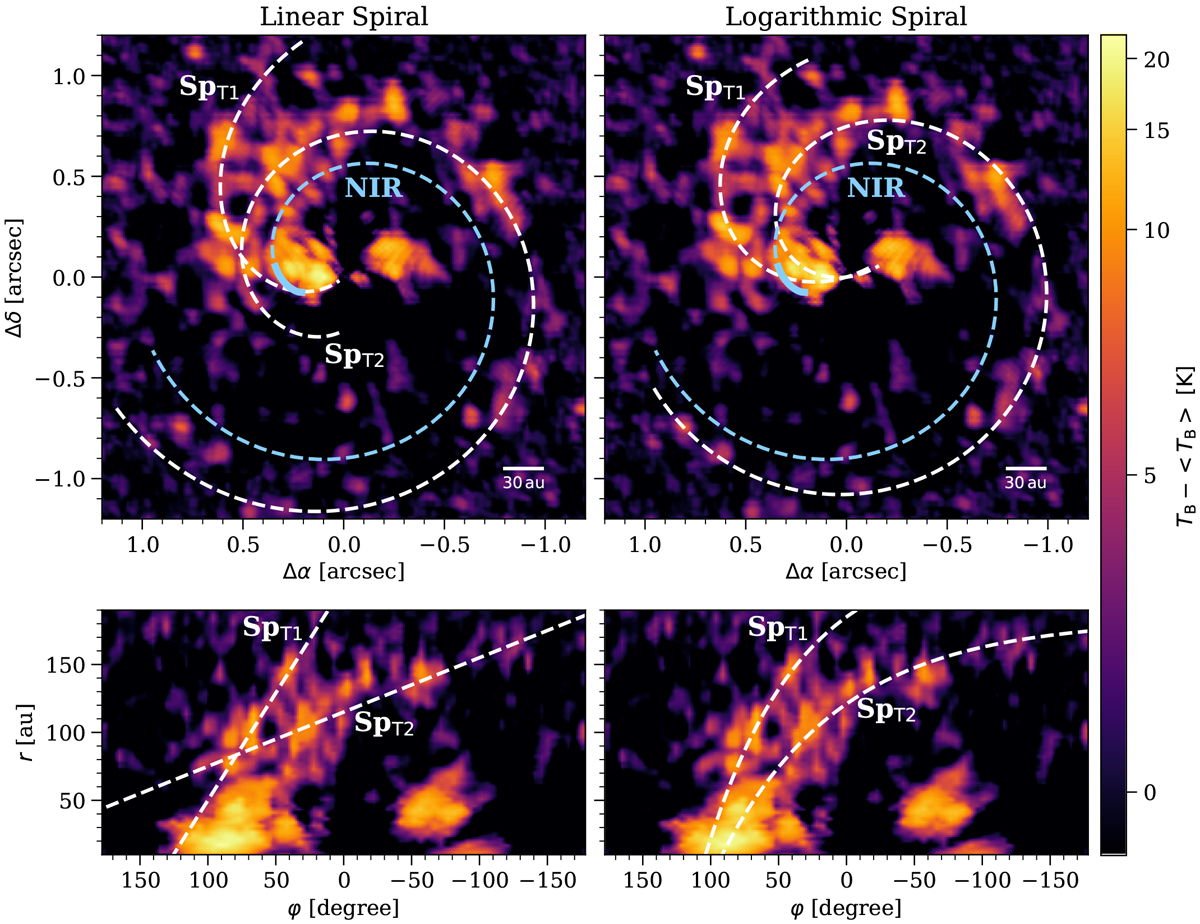
Deprojected and rotated (top panels) as well as polar-deprojected (bottom panels) TB residuals of 12CO with overlaid Archimedean and logarithmic spirals. The blue dashed lines show the fit of the spiral observed in the NIR by Uyama et al. (2020) extrapolated to large azimuthal angles. The solid blue line highlights the spiral region used by Uyama et al. (2020) to obtain the fit.
Current usage metrics show cumulative count of Article Views (full-text article views including HTML views, PDF and ePub downloads, according to the available data) and Abstracts Views on Vision4Press platform.
Data correspond to usage on the plateform after 2015. The current usage metrics is available 48-96 hours after online publication and is updated daily on week days.
Initial download of the metrics may take a while.