Open Access
Fig. C.1
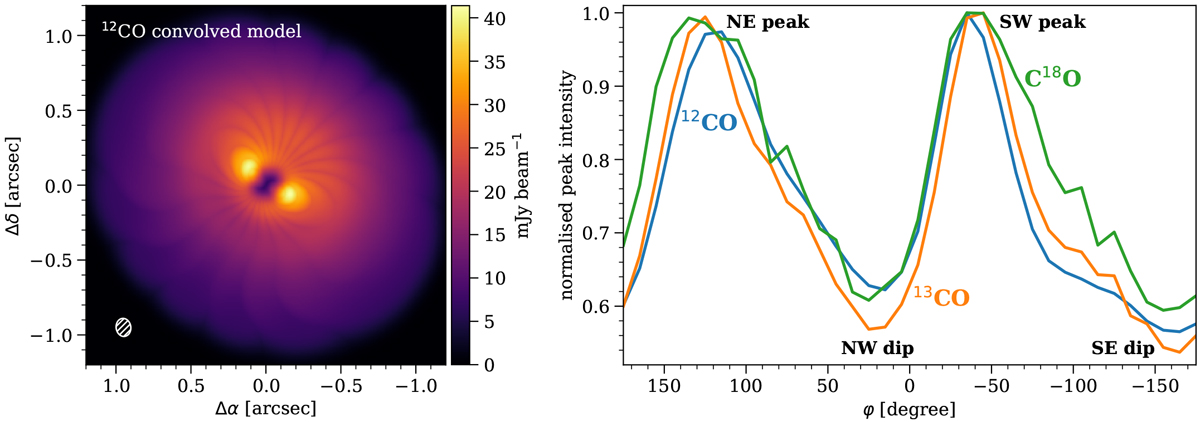
Left: peak intensity map from postprocessing the DALI model presented by Ubeira Gabellini et al. (2019), shown for 12CO. Right: azimuthal variations of the peak intensity of 12CO, 13 CO, and C18 O for an annulus of 20–40 au (0.′′12-0.′′25), derived from the DALI model and normalised to the peak value.
Current usage metrics show cumulative count of Article Views (full-text article views including HTML views, PDF and ePub downloads, according to the available data) and Abstracts Views on Vision4Press platform.
Data correspond to usage on the plateform after 2015. The current usage metrics is available 48-96 hours after online publication and is updated daily on week days.
Initial download of the metrics may take a while.