Free Access
Fig. A.1
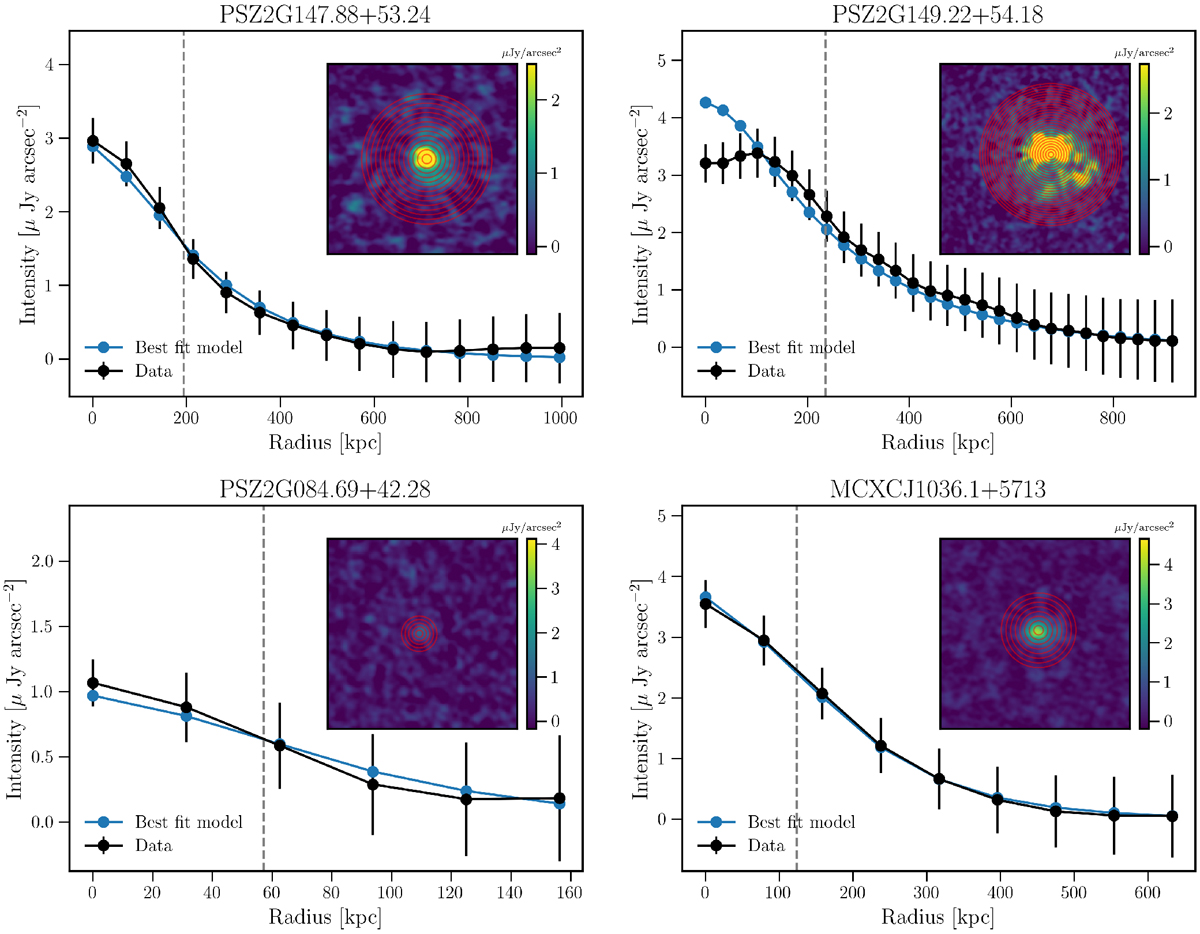
Azimuthally averaged surface brightness profiles for the clusters presented in this work. The inset images show the concentric annuli where the profile has been calculated, the width of the annuli is equal to the semi-major axis of the restoring beam. The dashed grey line indicates the best-fit e-folding radius.
Current usage metrics show cumulative count of Article Views (full-text article views including HTML views, PDF and ePub downloads, according to the available data) and Abstracts Views on Vision4Press platform.
Data correspond to usage on the plateform after 2015. The current usage metrics is available 48-96 hours after online publication and is updated daily on week days.
Initial download of the metrics may take a while.