Fig. 16
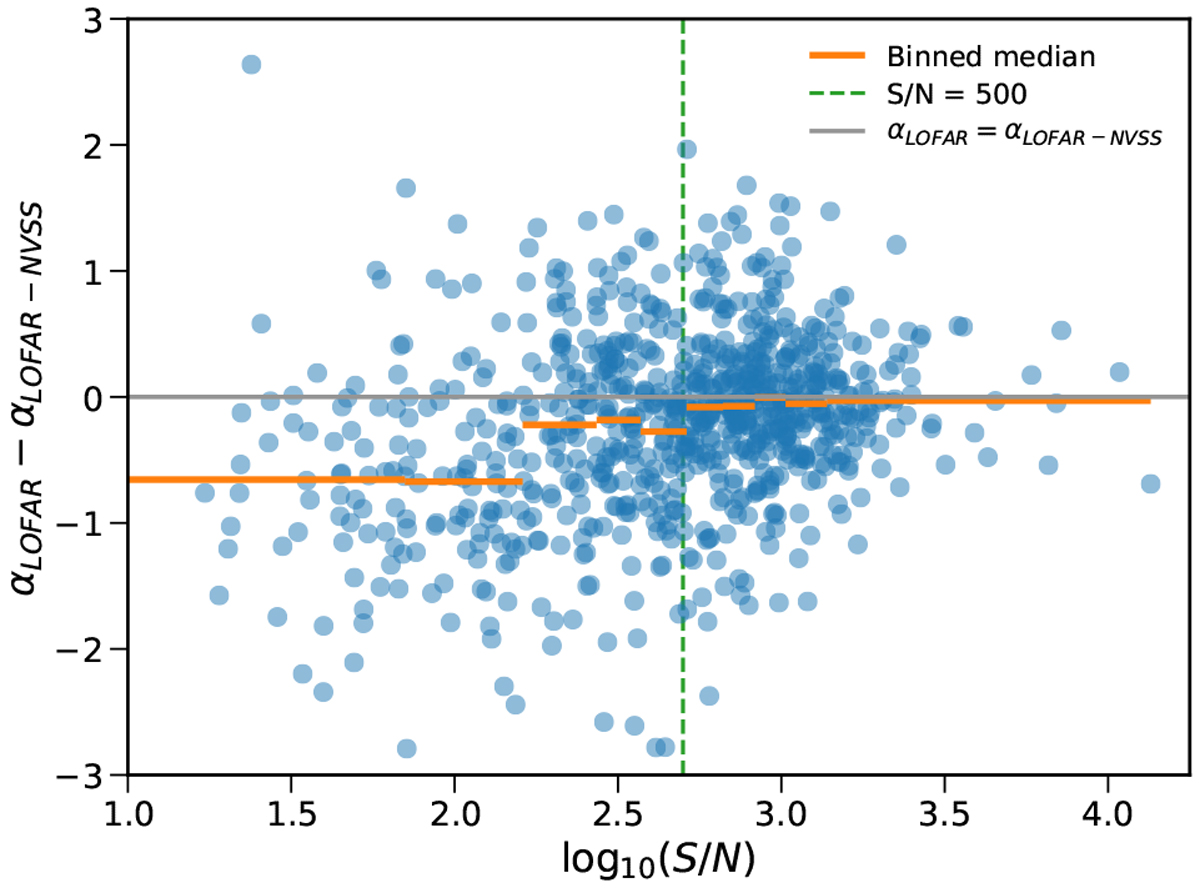
Difference between the intra-band spectral index (αLOFAR) and the NVSS to LOFAR spectral index (αLOFAR-NVSS) compared to the S/N of the cross-matched sources. The distribution of S/N is divided in deciles and the median of the difference is computed and shown as orange lines. The spectral indices are flatter (lower values of the difference) for low S/N likely due to incompletness effects. The distribution is close to zero (marked as a horizontal grey line) for sources with S∕N > 500 (shown as a vertical green dashed line).
Current usage metrics show cumulative count of Article Views (full-text article views including HTML views, PDF and ePub downloads, according to the available data) and Abstracts Views on Vision4Press platform.
Data correspond to usage on the plateform after 2015. The current usage metrics is available 48-96 hours after online publication and is updated daily on week days.
Initial download of the metrics may take a while.