Fig. 11
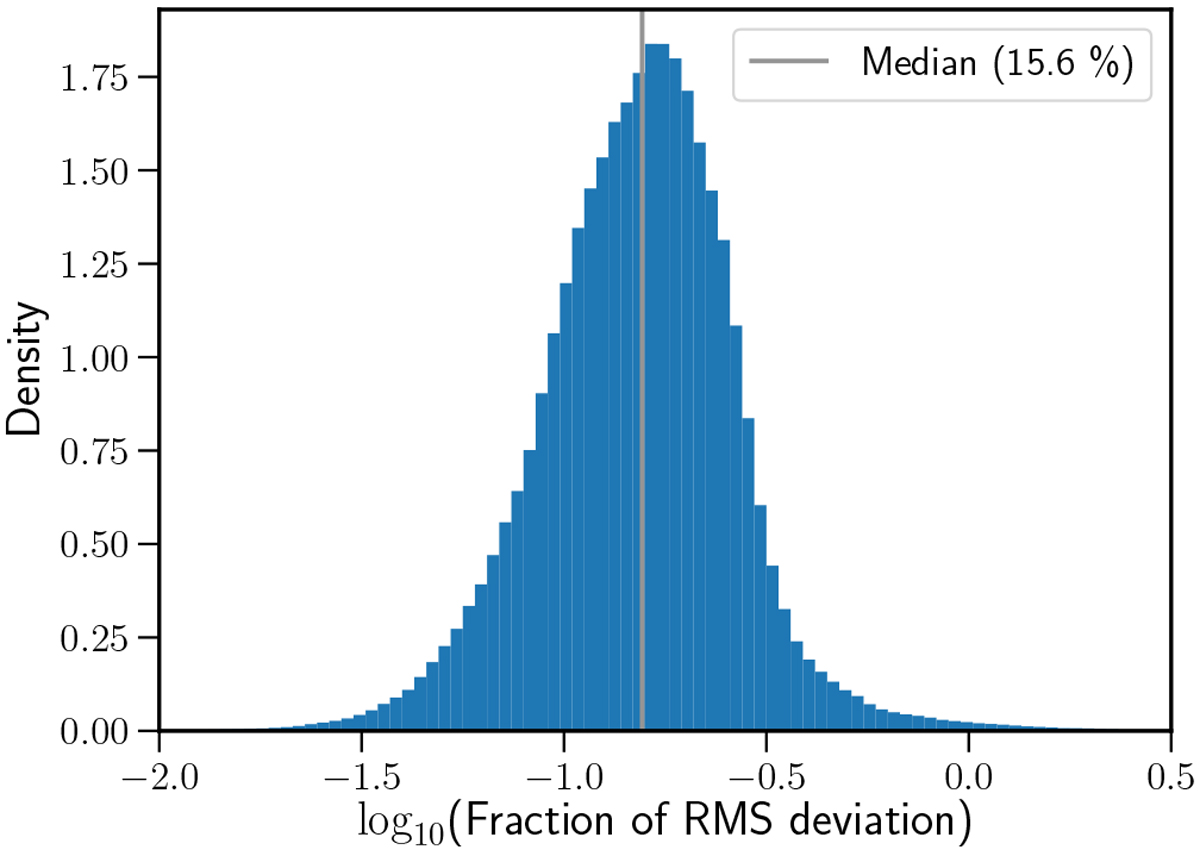
Histogram of the noise deviation in the combined image with respect to that predicted from the individual images, assuming that the noise in each is uncorrelated. The histogram is computed in the area closer than 3 degrees to the centre. The median value of the distribution (solid grey line) is a 15.6 per cent increase in noise in the deep image.
Current usage metrics show cumulative count of Article Views (full-text article views including HTML views, PDF and ePub downloads, according to the available data) and Abstracts Views on Vision4Press platform.
Data correspond to usage on the plateform after 2015. The current usage metrics is available 48-96 hours after online publication and is updated daily on week days.
Initial download of the metrics may take a while.