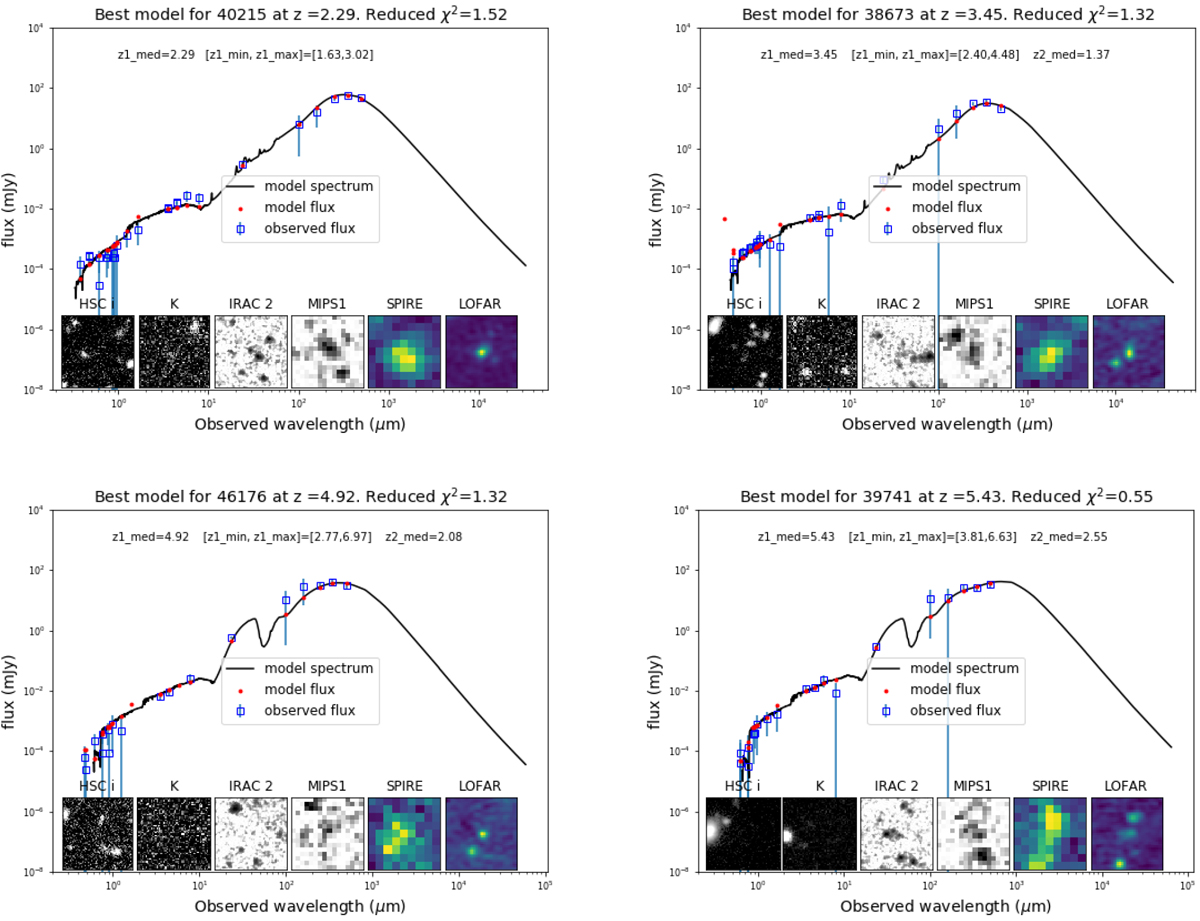
Fig. 9

Example SED fits of HLIRGs in the multiple category in ELAIS-N1. In each panel, z1_med corresponds to the primary redshift peak in the probability density function, [z1_min, z1_max] corresponds to the range between the lower and upper bounds of the primary 80% HPD CI peak, and z2_med corresponds to the secondary redshift peak (if present). Image cutouts from the optical to radio (from left to right, HSC i-band 10.8′′ × 10.8′′, DXS K-band 10.2′′ × 10.2′′, IRAC 4.5 μm 36.0′′ × 36.0′′, MIPS 24 μm 36.0′′ × 36.0′′, SPIRE 250 μm 54.0′′ × 54.0′′, and LOFAR 150 MHz 54.0′′ × 54.0′′) are shown in a row of insets at the bottom.
Current usage metrics show cumulative count of Article Views (full-text article views including HTML views, PDF and ePub downloads, according to the available data) and Abstracts Views on Vision4Press platform.
Data correspond to usage on the plateform after 2015. The current usage metrics is available 48-96 hours after online publication and is updated daily on week days.
Initial download of the metrics may take a while.


