Fig. 2
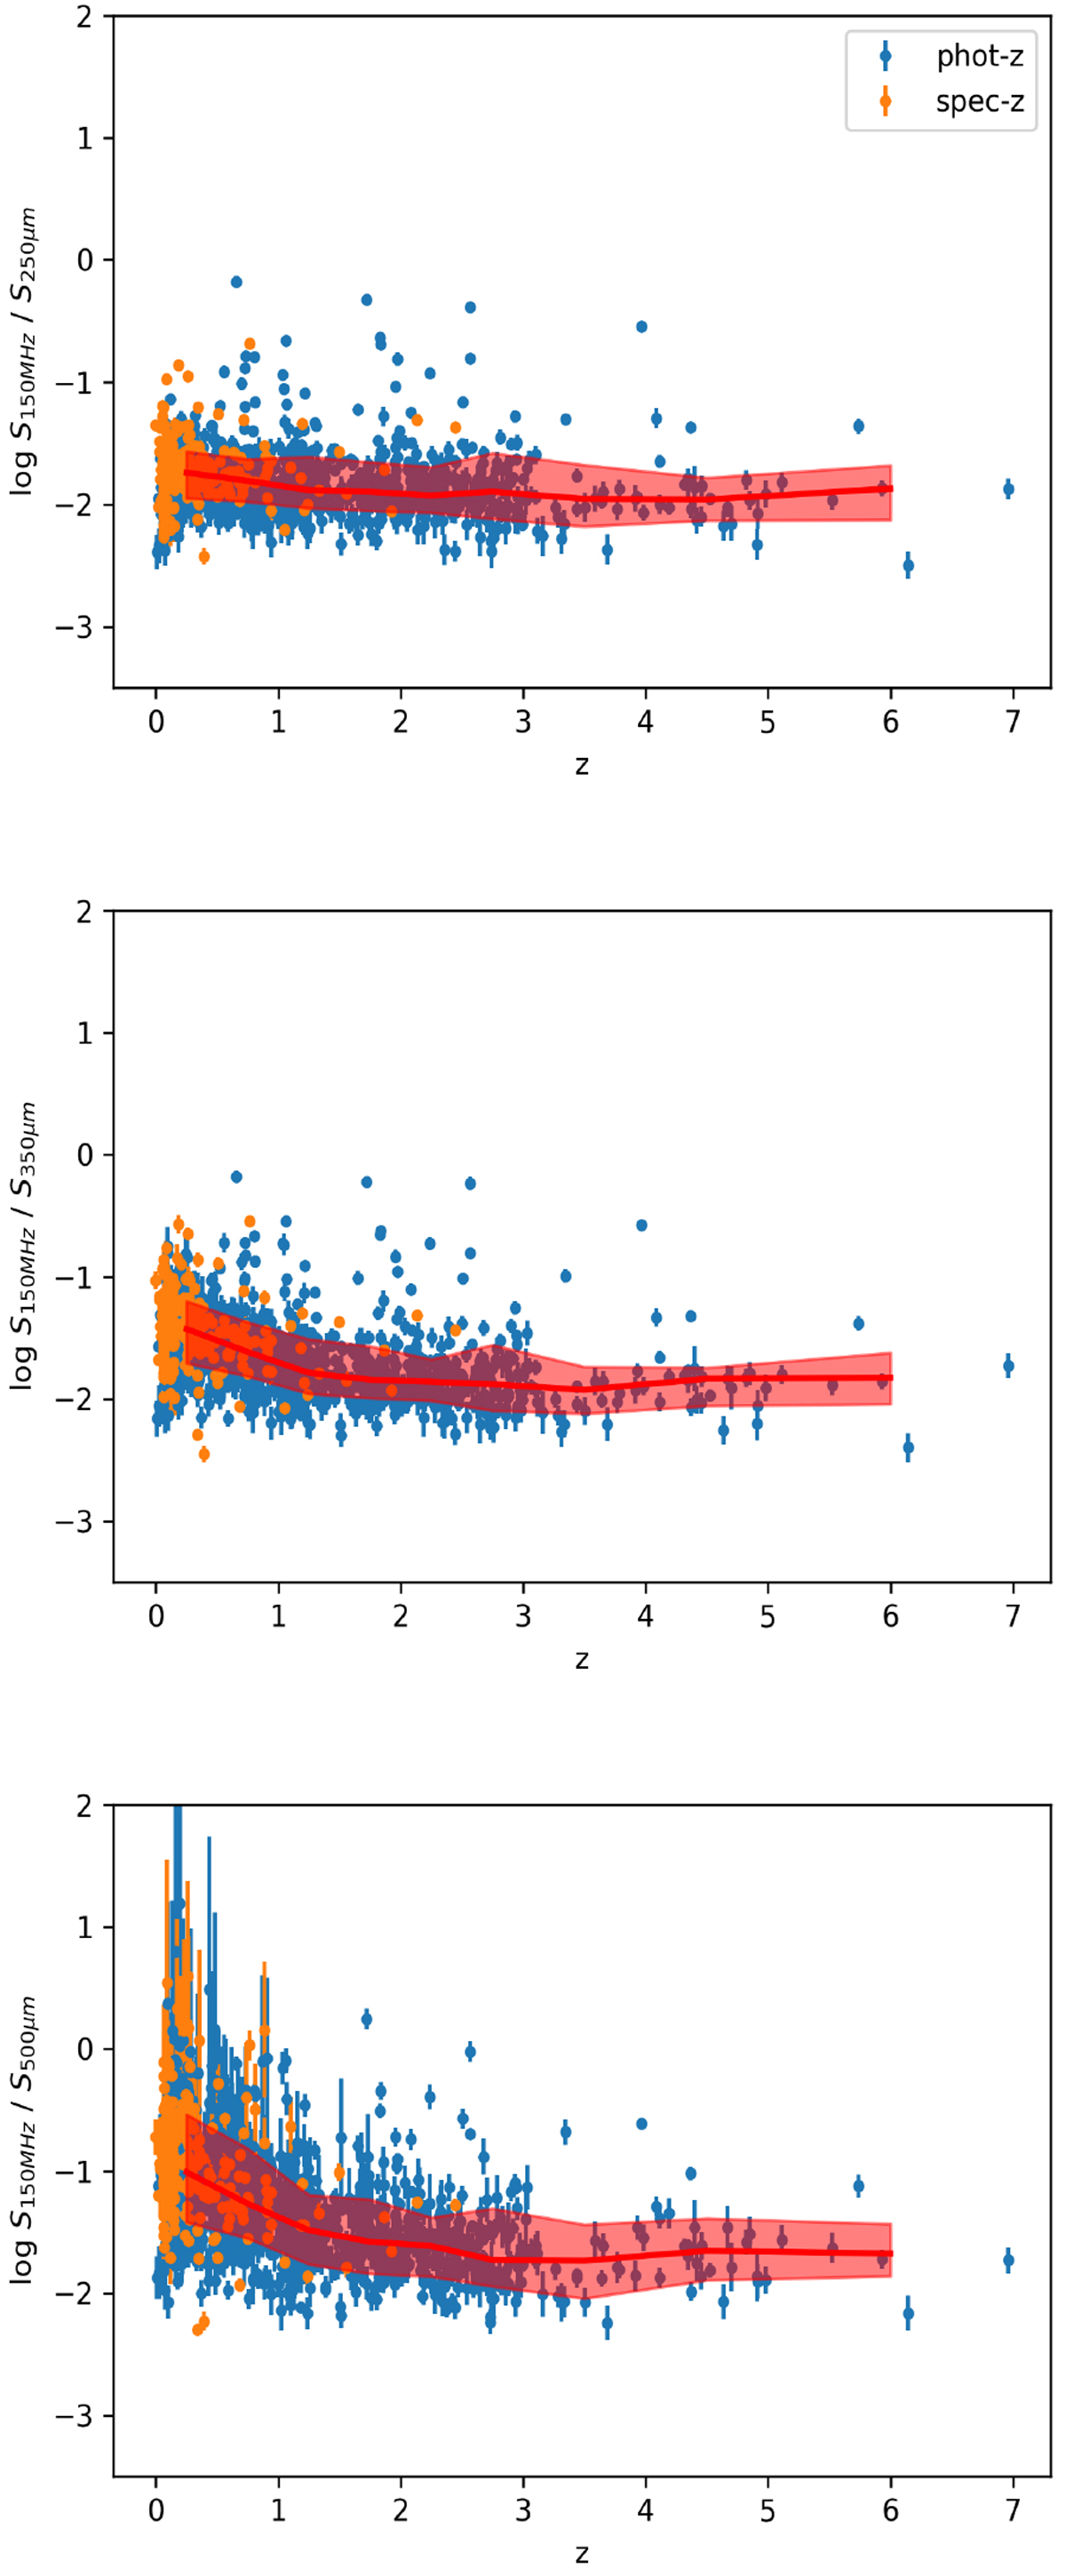
Fluxratios between the 150 MHz flux density and the flux densities at 250, 350, and 500 μm as a function of redshift (colour-coded by photometric or spectroscopic redshift) in ELAIS-N1. The red line shows the median flux ratios in bins of redshift (with the redshift bin width set to 0.5 at z < 3 and 1 at z > 3), and the shaded band shows the range between the 16th and 84th percentiles. The other two fields show similar patterns.
Current usage metrics show cumulative count of Article Views (full-text article views including HTML views, PDF and ePub downloads, according to the available data) and Abstracts Views on Vision4Press platform.
Data correspond to usage on the plateform after 2015. The current usage metrics is available 48-96 hours after online publication and is updated daily on week days.
Initial download of the metrics may take a while.