Fig. A.1
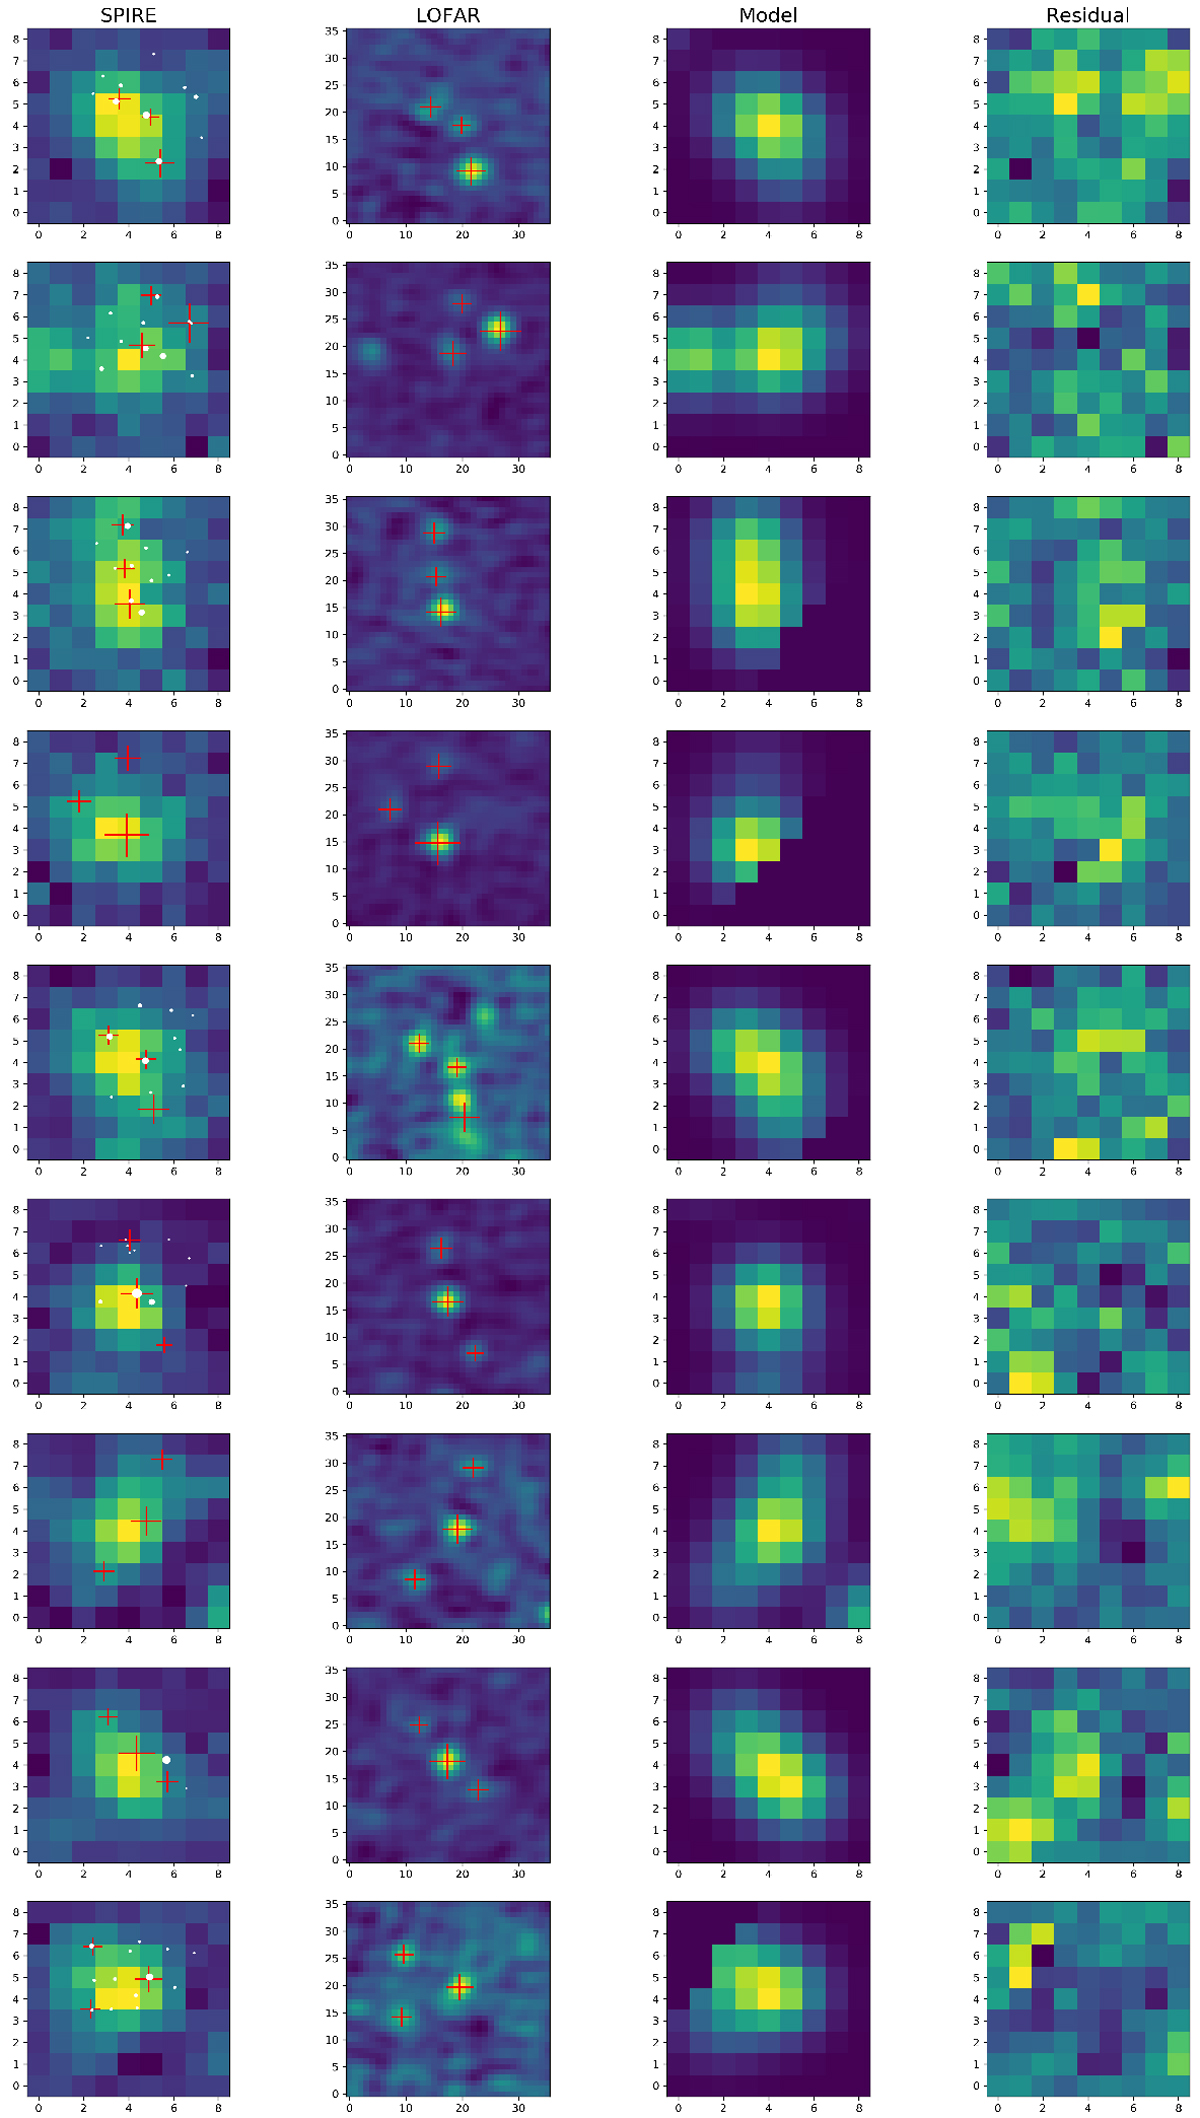
From left to right: columns show postage stamps of the original Herschel 250 μm image, the LOFAR 150 MHz image, the XID+ model image, and the XID+ residual image. First column: red plus signs indicate the positions of the LOFAR sources and the white dots indicate the positions of the IRAC sources (if present). The size of the symbol scales with the flux of the object. The SPIRE cutouts have a pixel size of 6′′, and the LOFAR cutouts have a pixel size of 1.5′′. All cutouts have a size of 54′′ × 54′′.
Current usage metrics show cumulative count of Article Views (full-text article views including HTML views, PDF and ePub downloads, according to the available data) and Abstracts Views on Vision4Press platform.
Data correspond to usage on the plateform after 2015. The current usage metrics is available 48-96 hours after online publication and is updated daily on week days.
Initial download of the metrics may take a while.