Fig. 8
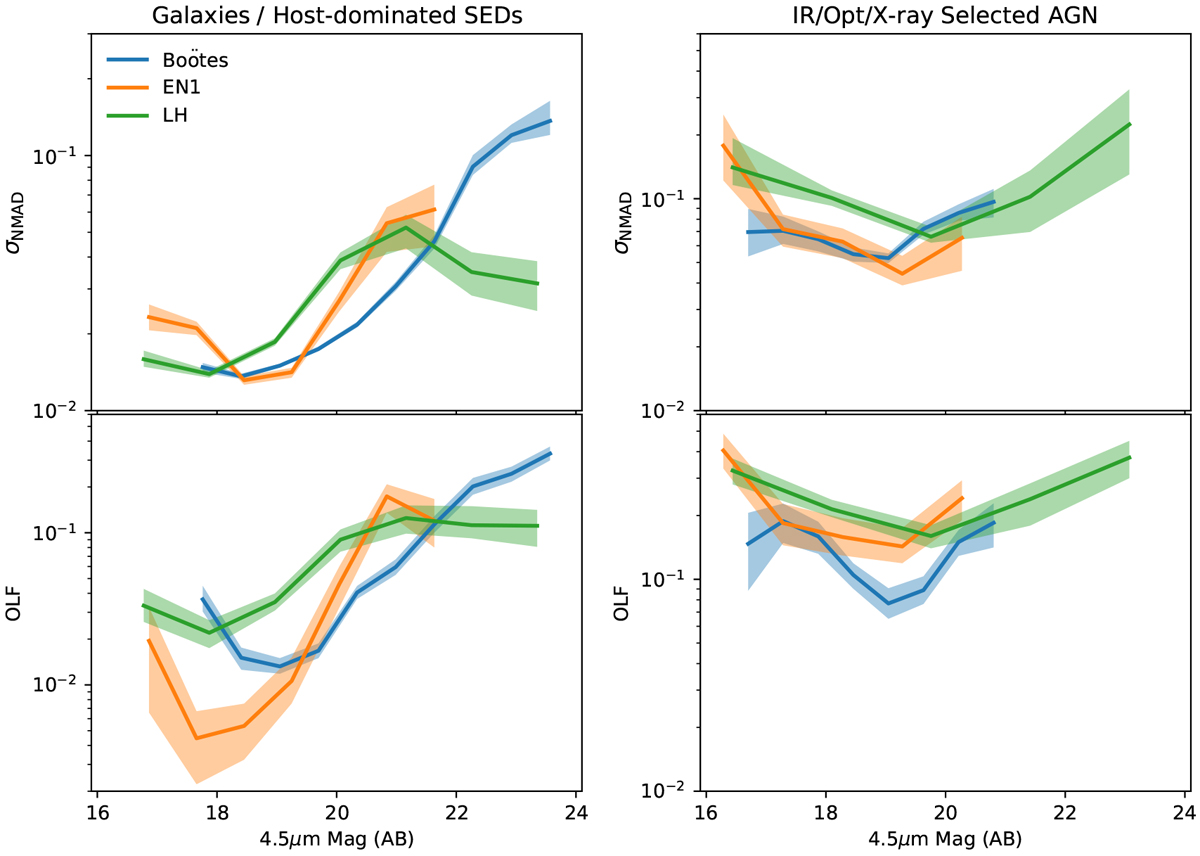
Robust scatter (σNMAD; upper panels) and OLF (lower panels) for the consensus photo-z estimates (z1,median) as a functionof 4.5 μm magnitude. Shaded regions illustrate the statistical uncertainties on the respective metrics derived from bootstrap resampling. The magnitude range plotted for each field is representative of the magnitude distribution of the spectroscopic sample and is not indicative of the relative photometric depths (see Fig. 1).
Current usage metrics show cumulative count of Article Views (full-text article views including HTML views, PDF and ePub downloads, according to the available data) and Abstracts Views on Vision4Press platform.
Data correspond to usage on the plateform after 2015. The current usage metrics is available 48-96 hours after online publication and is updated daily on week days.
Initial download of the metrics may take a while.