Fig. 6
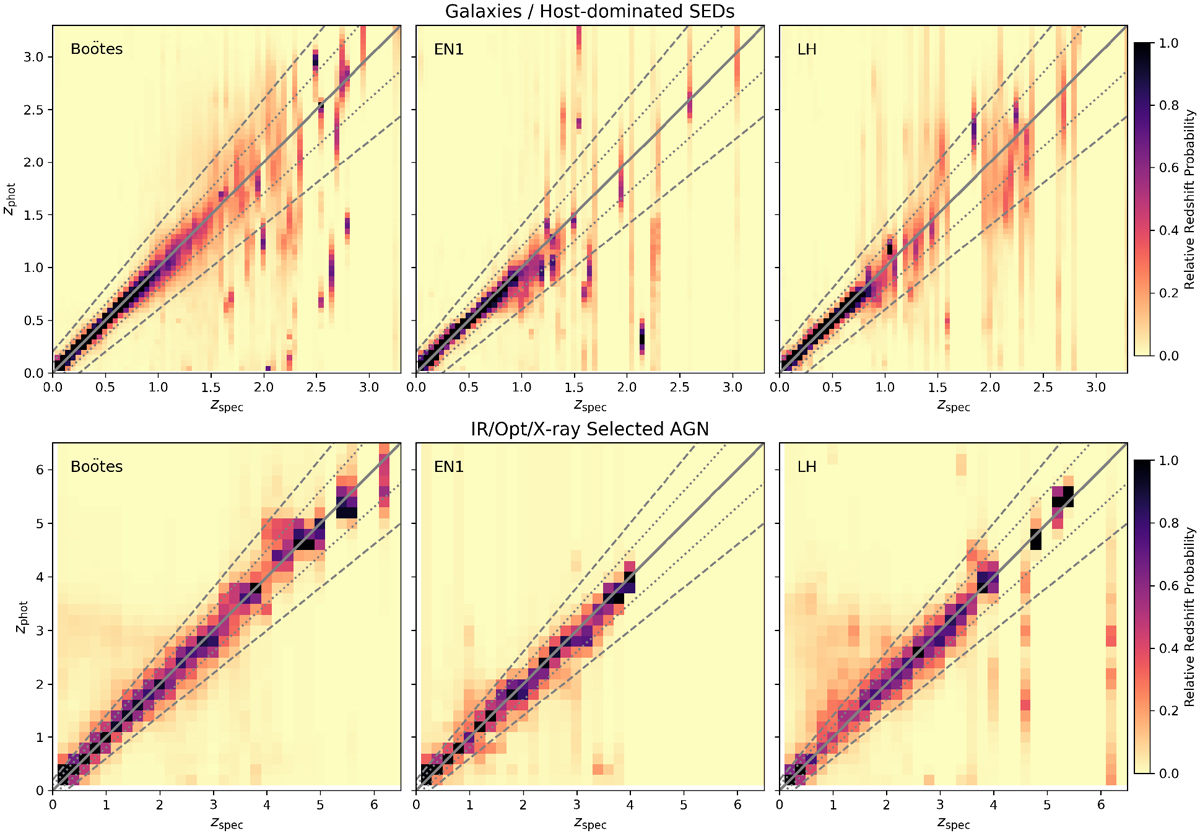
Stacked redshift posterior estimates for the galaxy (or host-dominated) population (top) and for the combined AGN selected population (bottom; IR, X-ray or optically selected) for each of the three fields. The spectroscopic redshift samples available become particularly sparse at z > 1 for the EN1 and LH fields. Grey dotted and dashed line correspond to ± 0.1 × (1 + zspec) and ± 0.2 × (1 + zspec), respectively. The colour scale is illustrative and represents the summed P(z) (normalised such that ∫P(z)dz = 1) for each zspec bin, more precise photo-z therefore result in darker peaks.
Current usage metrics show cumulative count of Article Views (full-text article views including HTML views, PDF and ePub downloads, according to the available data) and Abstracts Views on Vision4Press platform.
Data correspond to usage on the plateform after 2015. The current usage metrics is available 48-96 hours after online publication and is updated daily on week days.
Initial download of the metrics may take a while.