Fig. 3
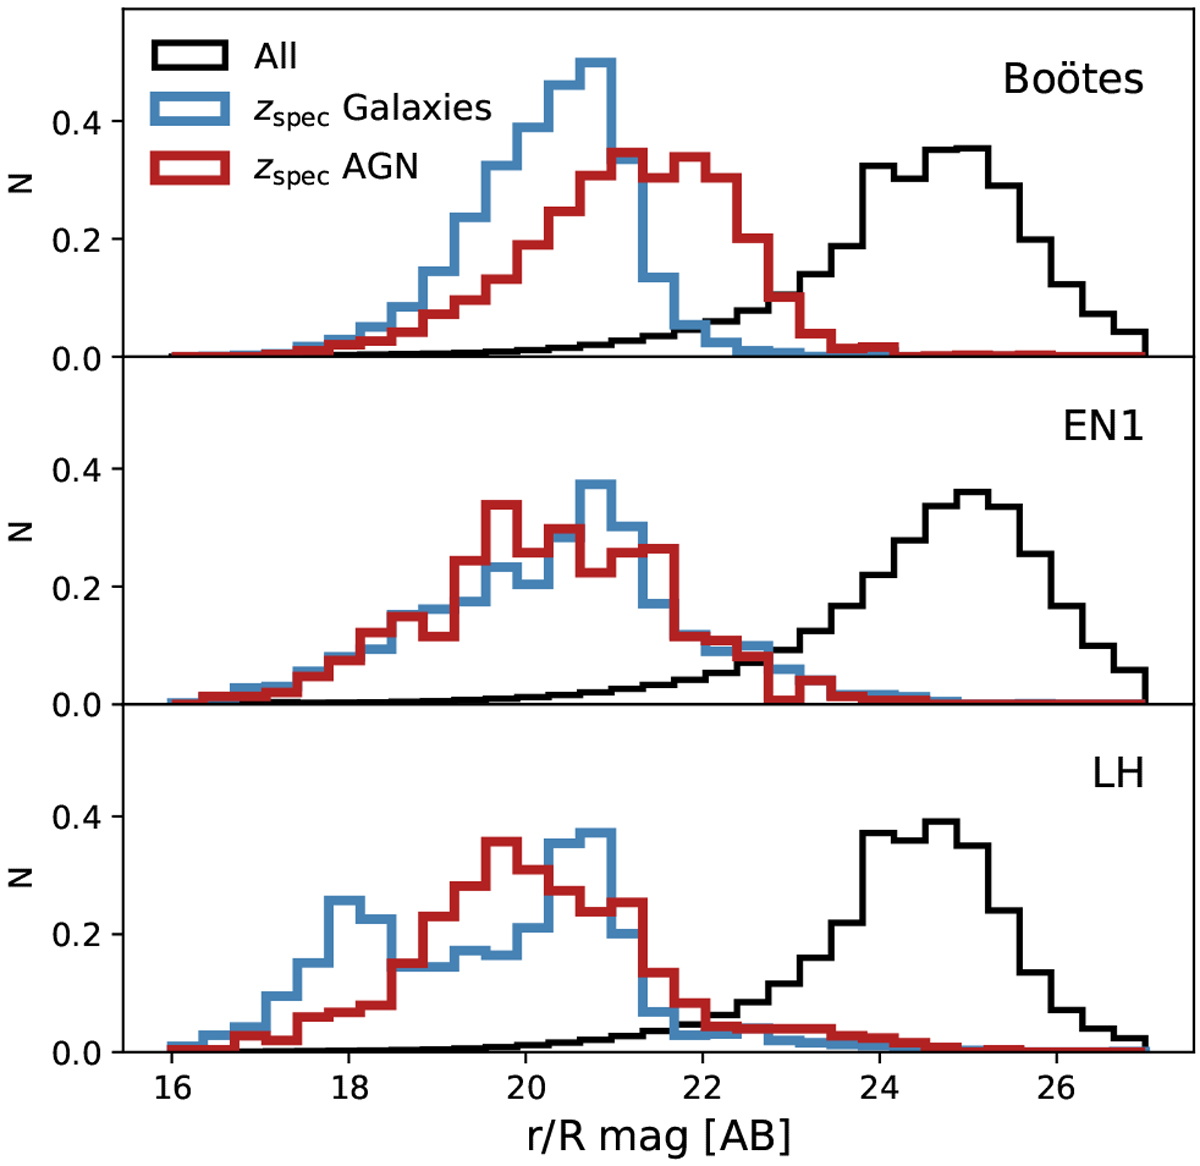
Normalised optical magnitude distributions for the galaxy (blue histogram) and AGN (red histrogram) spectroscopic redshift samples in comparison to the full parent photometric sample. For EN1 and LH we plot the r-band magnitude distribution, while for Boötes we show the nearest equivalent wavelength, R. The offset in the magnitude distributions highlights the importance of high quality template estimates in the regime where spectroscopic training samples are not available.
Current usage metrics show cumulative count of Article Views (full-text article views including HTML views, PDF and ePub downloads, according to the available data) and Abstracts Views on Vision4Press platform.
Data correspond to usage on the plateform after 2015. The current usage metrics is available 48-96 hours after online publication and is updated daily on week days.
Initial download of the metrics may take a while.