Fig. 14
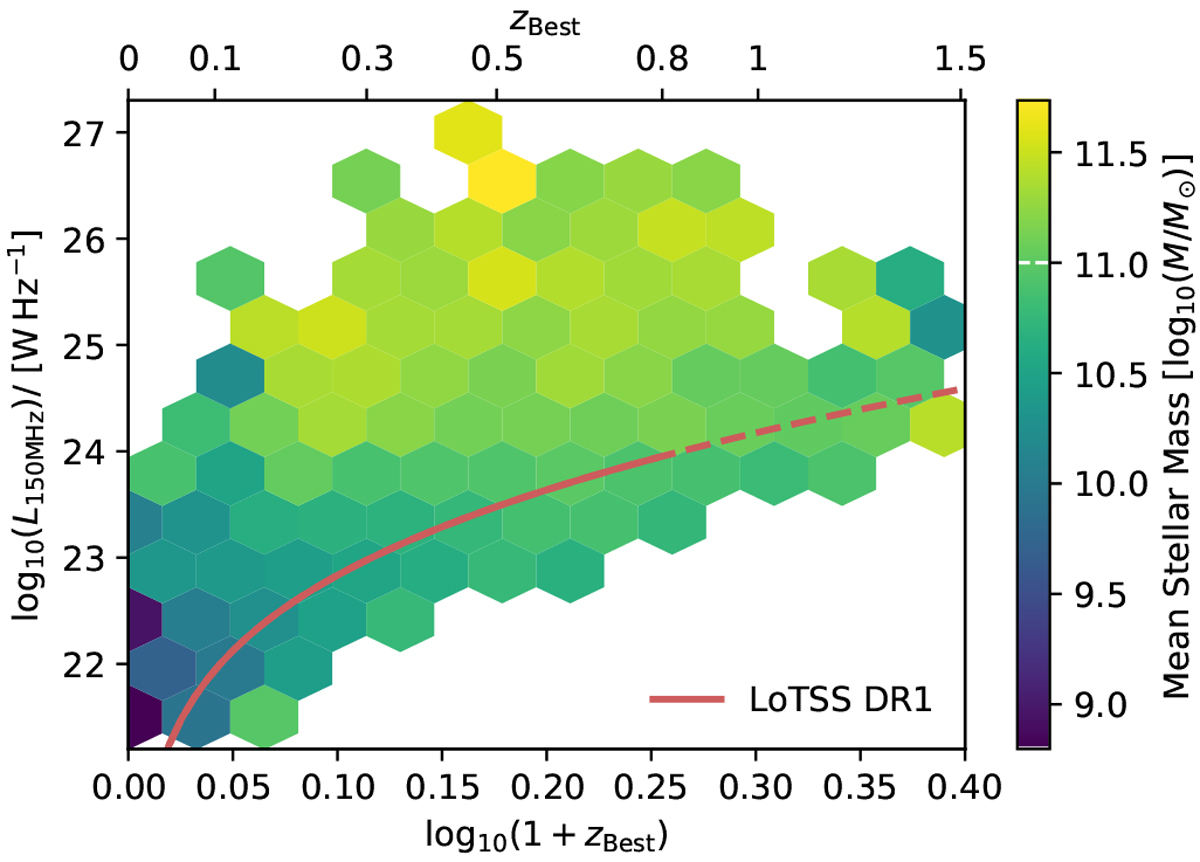
Average stellar mass (taken as the mean in log10 space) of the LoTSS Deep radio population as a function of redshift, zBest (Z_BEST in our catalogues), and radio power L150MHz – assuming aconstant spectral index of α = −0.7. The 5σ luminosity limit for the wide area LoTSS DR1 (Shimwell et al. 2019) data is plotted in red for comparison (with the solid line representing the redshift range with high quality photo-z for the comparable galaxy population D19). The typical M⋆ for the galaxy SMF at these redshifts is marked on the colour scale for reference (white dashed line).
Current usage metrics show cumulative count of Article Views (full-text article views including HTML views, PDF and ePub downloads, according to the available data) and Abstracts Views on Vision4Press platform.
Data correspond to usage on the plateform after 2015. The current usage metrics is available 48-96 hours after online publication and is updated daily on week days.
Initial download of the metrics may take a while.