Fig. 13
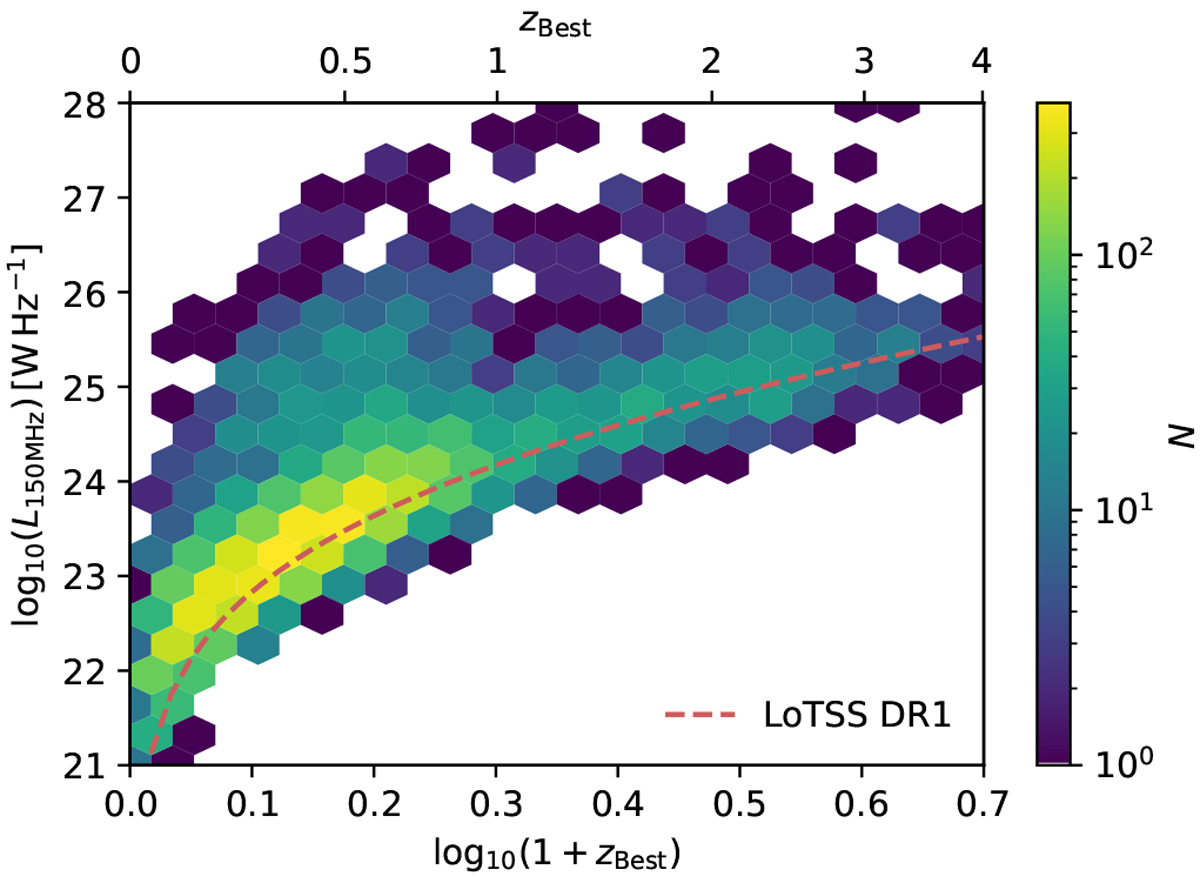
Distribution of LoTSS Deep Field sources as a function of redshift, zBest (Z_BEST in our catalogues), and radio power L150MHz assuming a constant spectral index of α = −0.7. The colour scale illustrates the combined number of sources across the three deep fields with a logarithmic scale. The 5σ luminosity limit for the wide area LoTSS DR1 (Shimwell et al. 2019) data is plotted in red for comparison.
Current usage metrics show cumulative count of Article Views (full-text article views including HTML views, PDF and ePub downloads, according to the available data) and Abstracts Views on Vision4Press platform.
Data correspond to usage on the plateform after 2015. The current usage metrics is available 48-96 hours after online publication and is updated daily on week days.
Initial download of the metrics may take a while.