Fig. 11
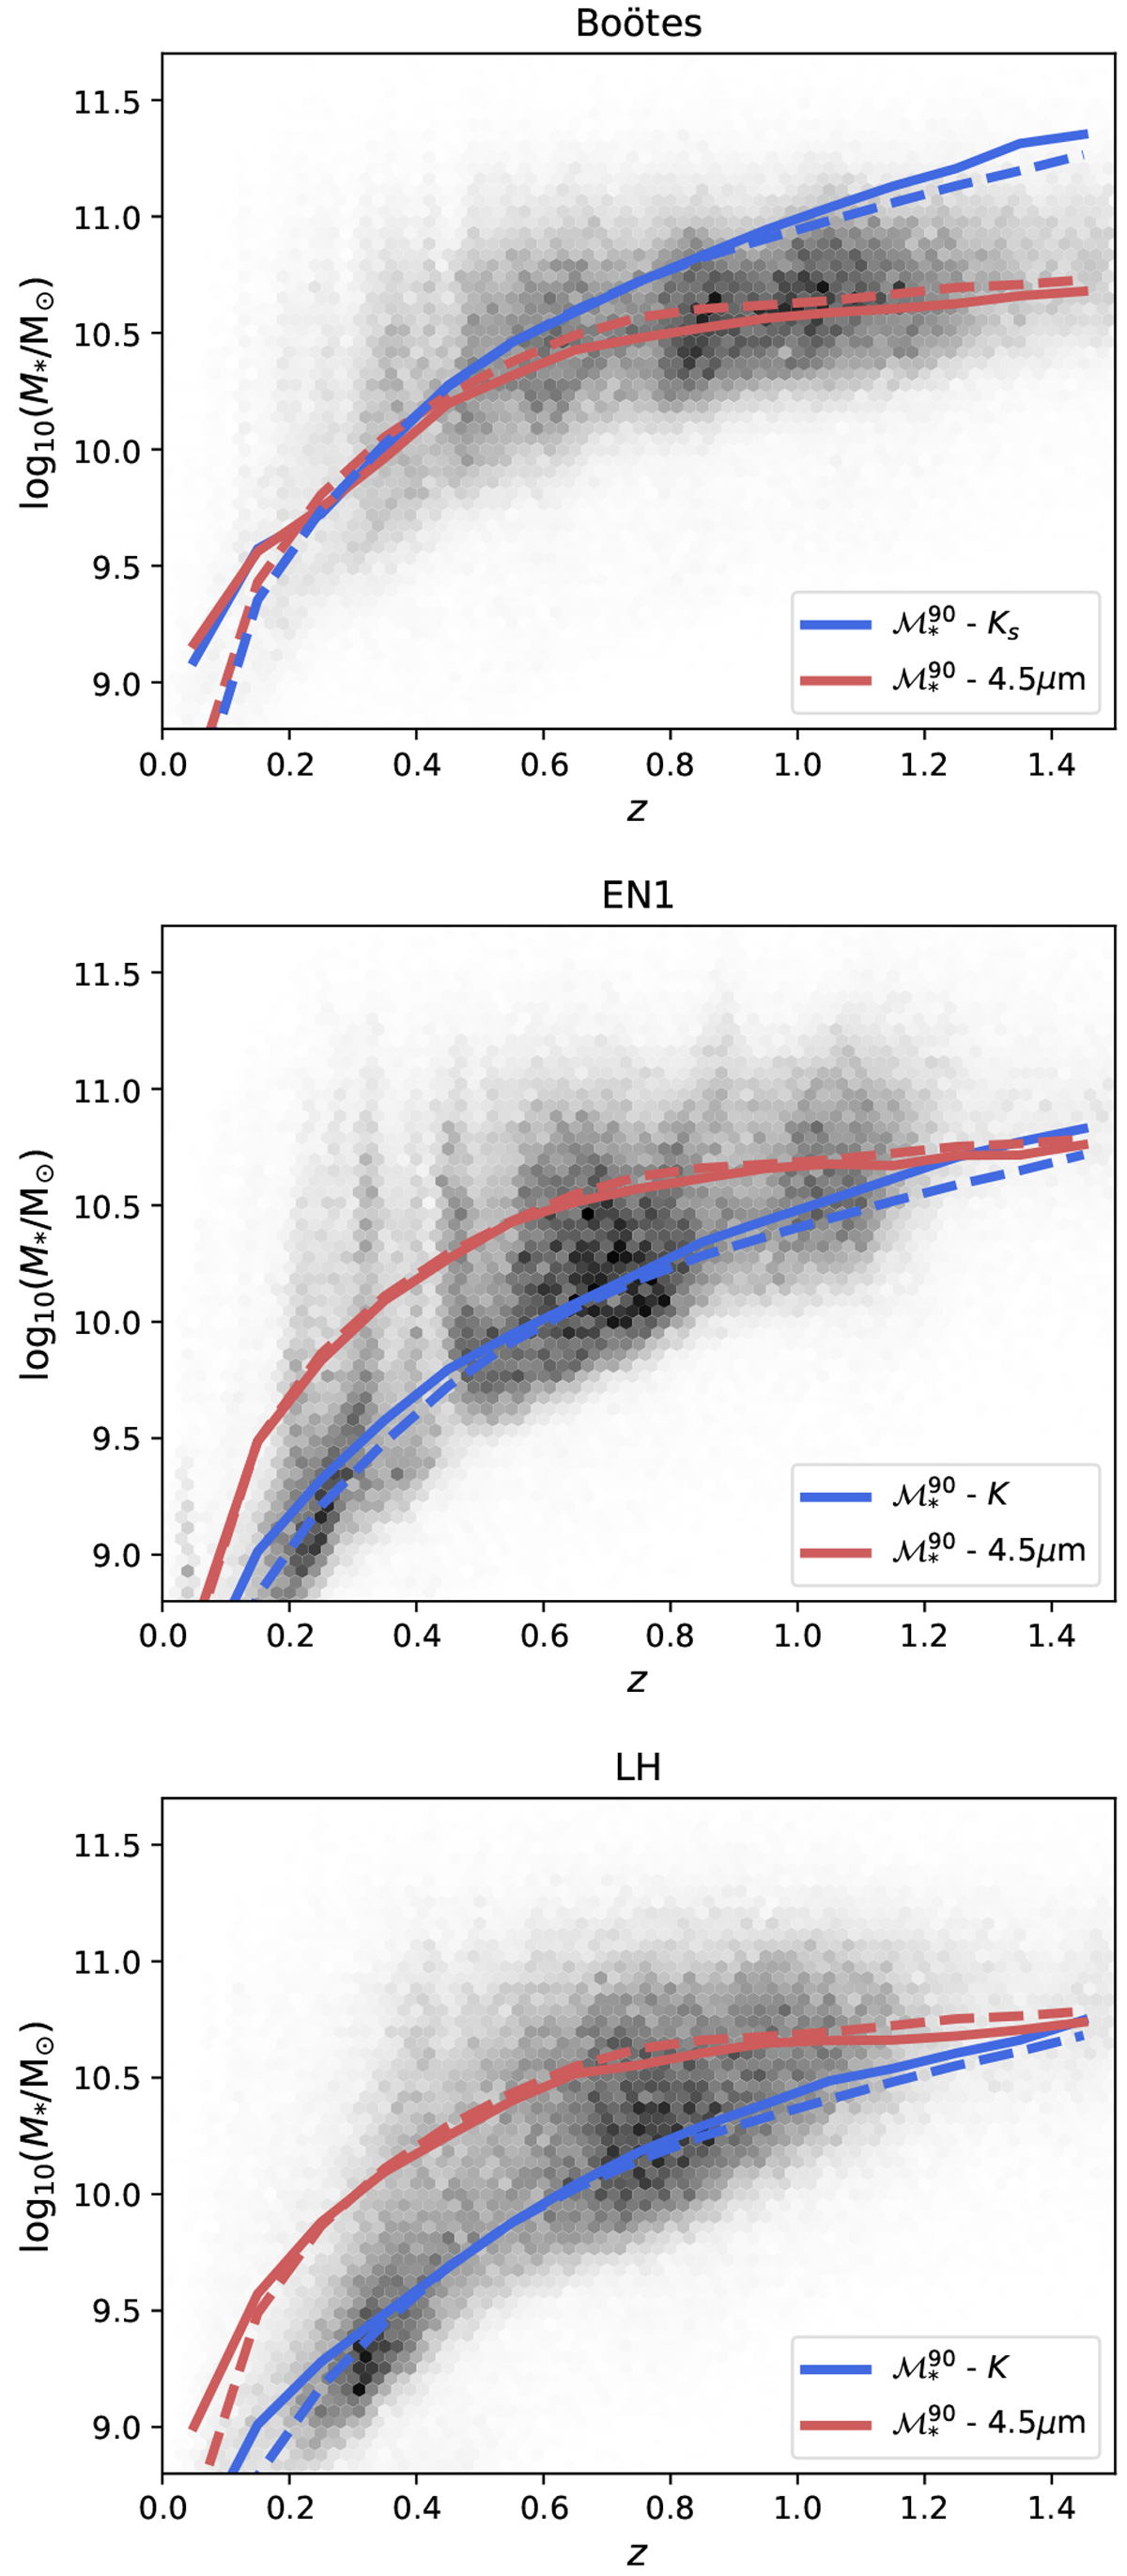
Observed stellar mass distribution as a function of redshift for the three LoTSS Deep Fields. The background density plot shows the mass distribution of sources brighter than the 90% magnitude limit of the most sensitive reference band available in that field (4.5 μm for Boötes and K for EN1 and LH). Solid lines represent the 90% mass completeness limits,
![]() , derived empirically (Pozzetti et al. 2010) and dashed lines show the corresponding limits derived from model stellar populations. The blue completeness curves are derived based on the
K
or Ks magnitude limit, while red curves are derived from the widest area 4.5 μm limit (i.e. SWIRE for EN1 and LH).
, derived empirically (Pozzetti et al. 2010) and dashed lines show the corresponding limits derived from model stellar populations. The blue completeness curves are derived based on the
K
or Ks magnitude limit, while red curves are derived from the widest area 4.5 μm limit (i.e. SWIRE for EN1 and LH).
Current usage metrics show cumulative count of Article Views (full-text article views including HTML views, PDF and ePub downloads, according to the available data) and Abstracts Views on Vision4Press platform.
Data correspond to usage on the plateform after 2015. The current usage metrics is available 48-96 hours after online publication and is updated daily on week days.
Initial download of the metrics may take a while.