Fig. 1
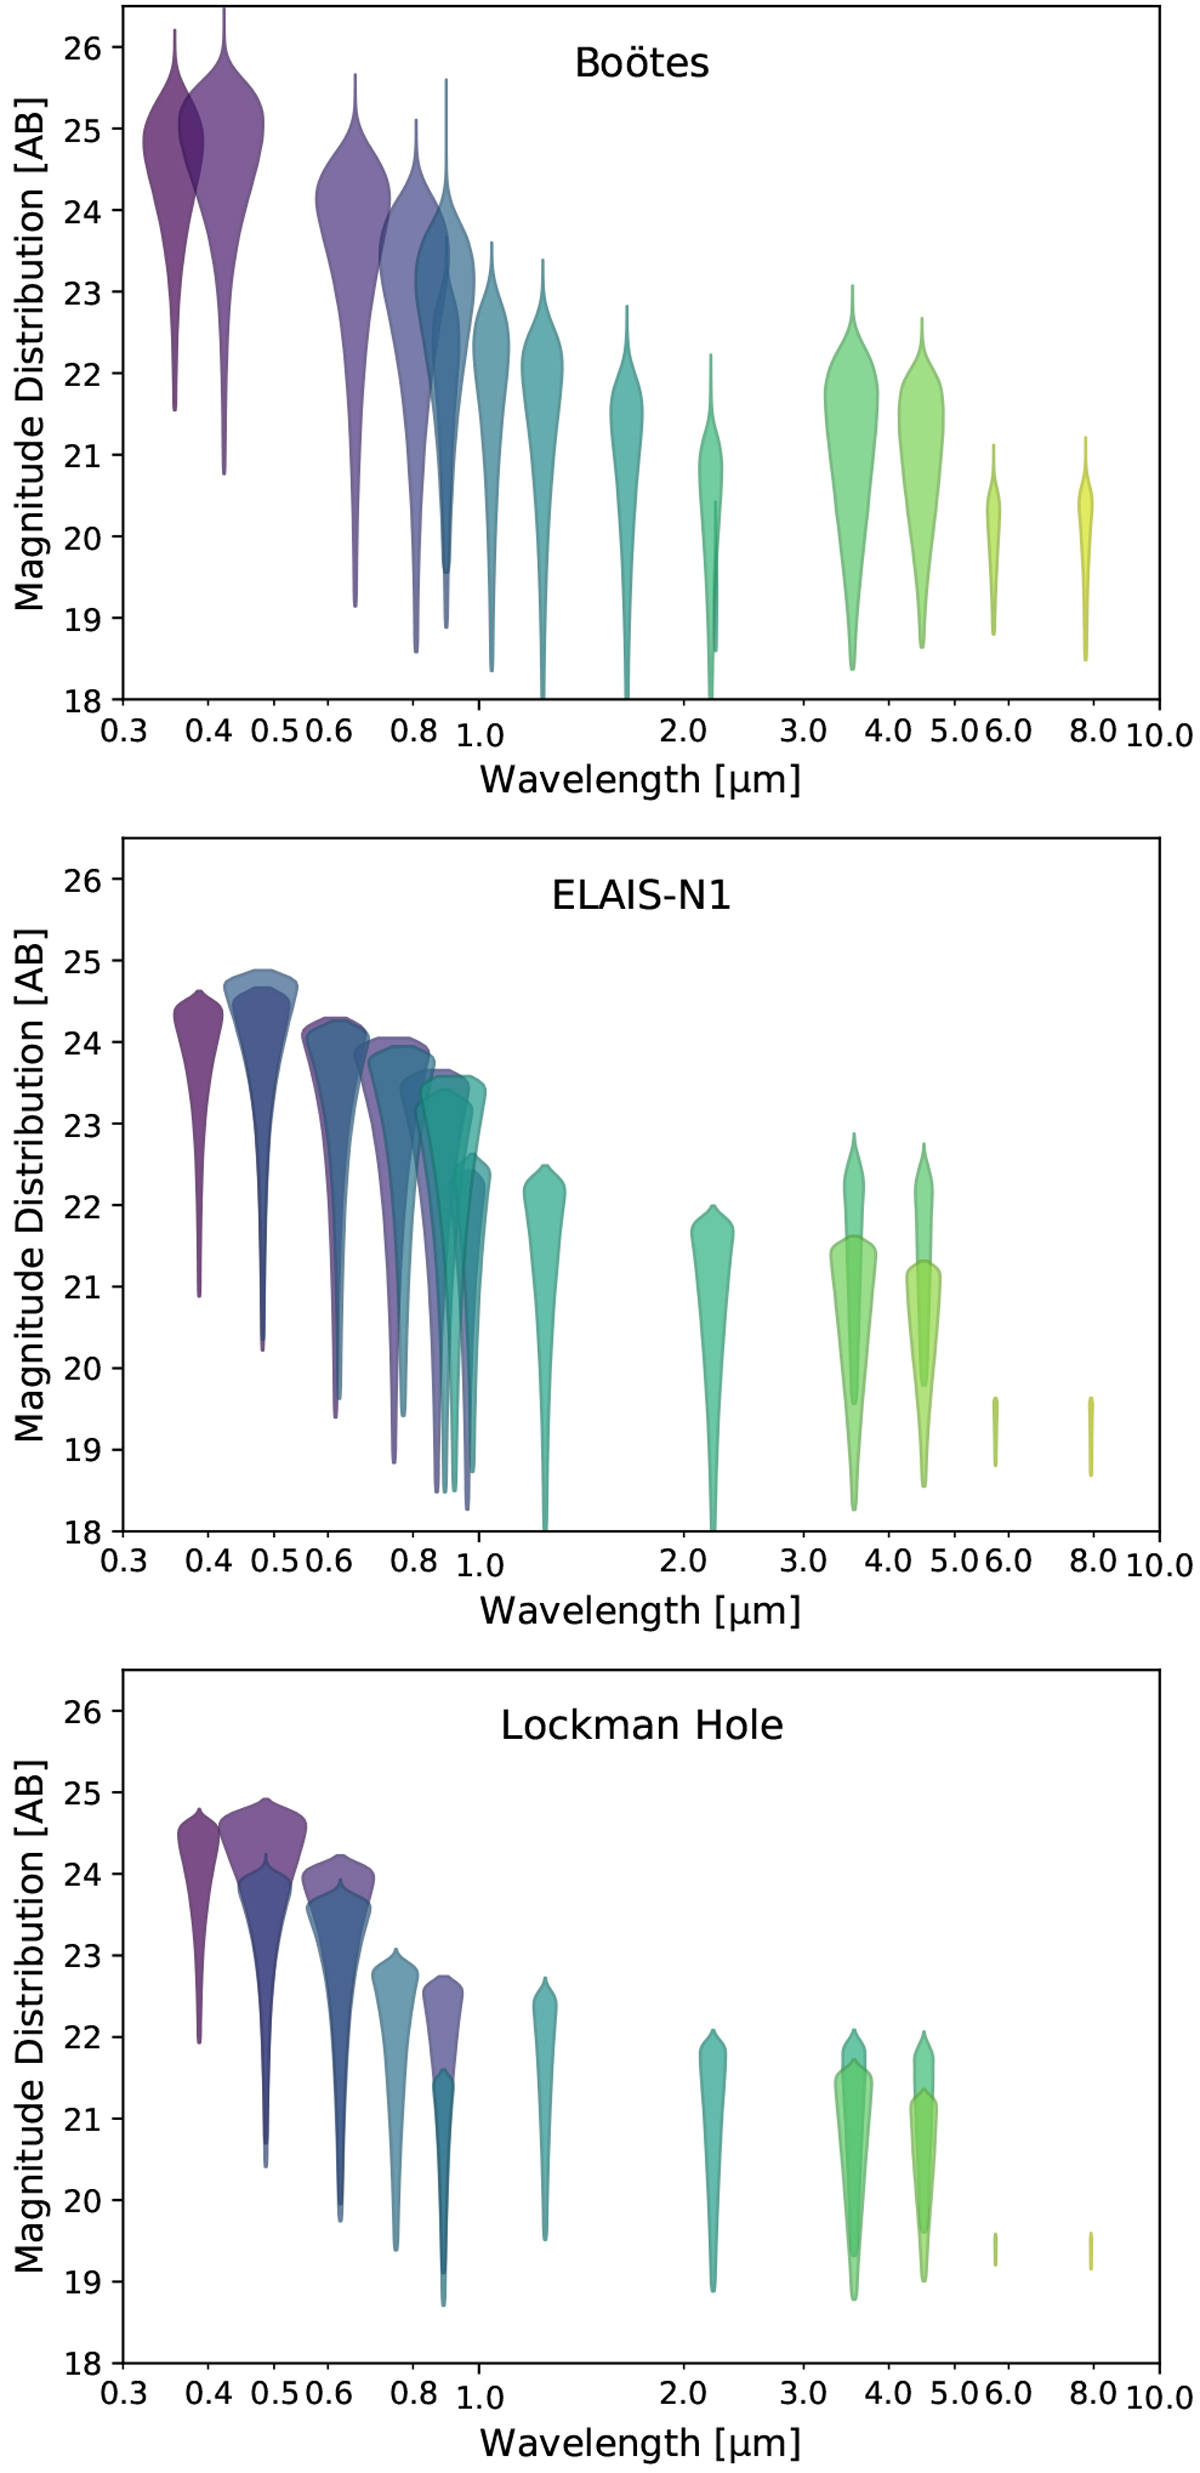
Illustration of the wavelength coverage and depths for the photometric datasets used for photo-z estimation in the three LoTSS Deep Fields. The violin plot for each filter shows the distribution of magnitudes for 5σ sources. The widths of the violin plots are indicative of the area available at a given depth within each field and are scaled by the fraction of sources with 5σ detections compared to the total size of the catalog. For example, the deeper Spitzer IRAC photometry of the smaller SERVS regions (at 3.6 and 4.5 μm) are evident in the EN1 and LH plots.
Current usage metrics show cumulative count of Article Views (full-text article views including HTML views, PDF and ePub downloads, according to the available data) and Abstracts Views on Vision4Press platform.
Data correspond to usage on the plateform after 2015. The current usage metrics is available 48-96 hours after online publication and is updated daily on week days.
Initial download of the metrics may take a while.