Fig. 9.
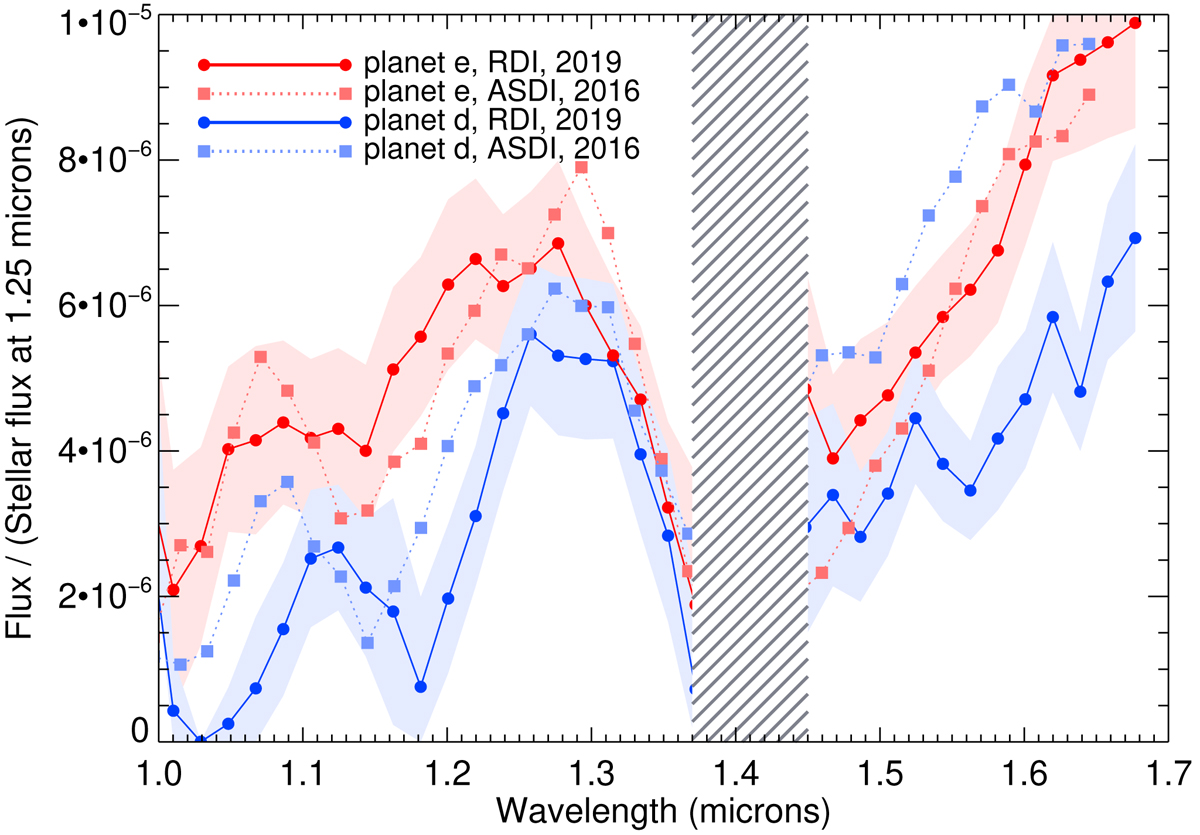
Spectra extracted by RDI for planets d and e in 2019 compared with their ADI-extracted spectra from 2016 as reported in Zurlo et al. (2016). The 2016 and 2019 planet spectra are matched at 1.25 μm for easier comparison of their shapes. The shaded regions indicate the 1σ error ranges of the spectra. The wavelength range 1.37–1.45 μm, which is dominated by telluric lines, is not shown.
Current usage metrics show cumulative count of Article Views (full-text article views including HTML views, PDF and ePub downloads, according to the available data) and Abstracts Views on Vision4Press platform.
Data correspond to usage on the plateform after 2015. The current usage metrics is available 48-96 hours after online publication and is updated daily on week days.
Initial download of the metrics may take a while.