Fig. 8.
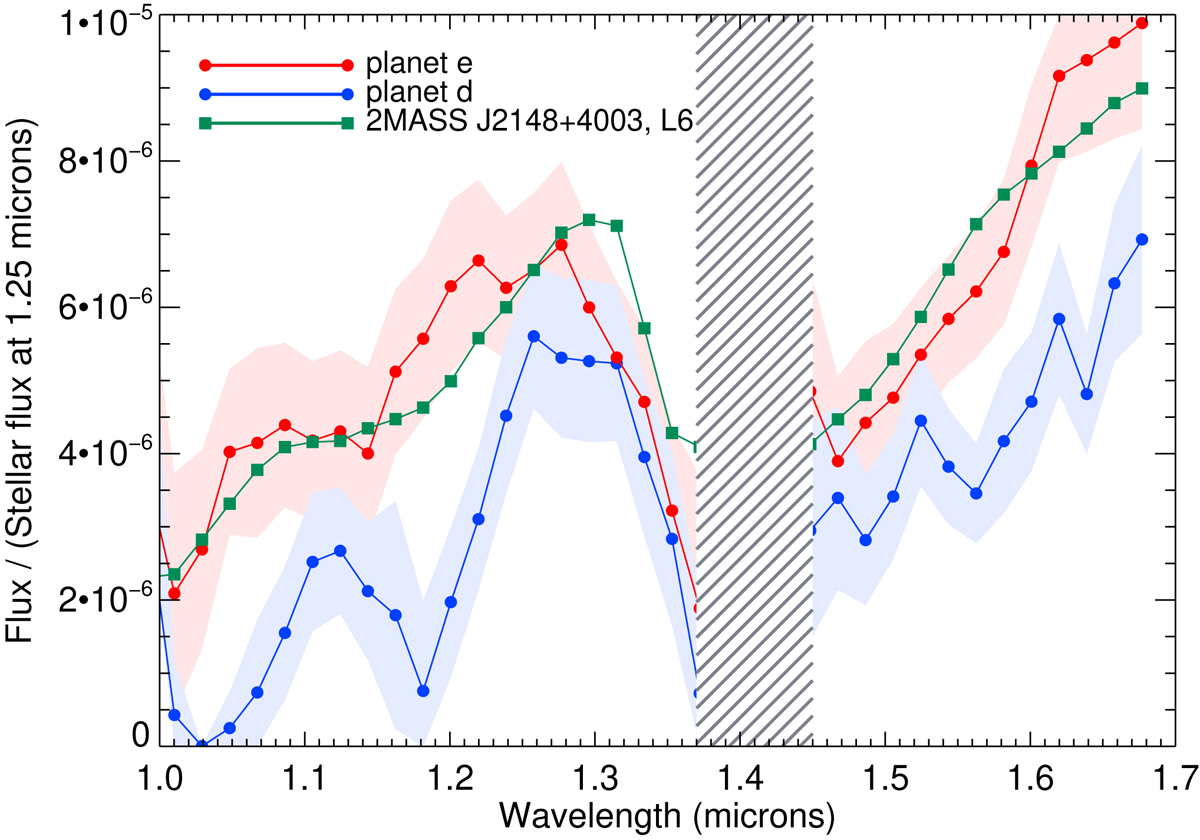
Spectra for planets d and e compared with that of the L6 object, 2MASS J2148+4003 from Looper et al. (2008). The planet spectra have been divided by the stellar flux at 1.25 μm to show the contrast at that wavelength. The L6 object spectra has been scaled to match planet e at 1.25 μm. The shaded regions indicate the 1σ error ranges of the spectra. The wavelength range 1.37–1.45 μm, which is dominated by telluric lines, is not shown.
Current usage metrics show cumulative count of Article Views (full-text article views including HTML views, PDF and ePub downloads, according to the available data) and Abstracts Views on Vision4Press platform.
Data correspond to usage on the plateform after 2015. The current usage metrics is available 48-96 hours after online publication and is updated daily on week days.
Initial download of the metrics may take a while.