Fig. 7.
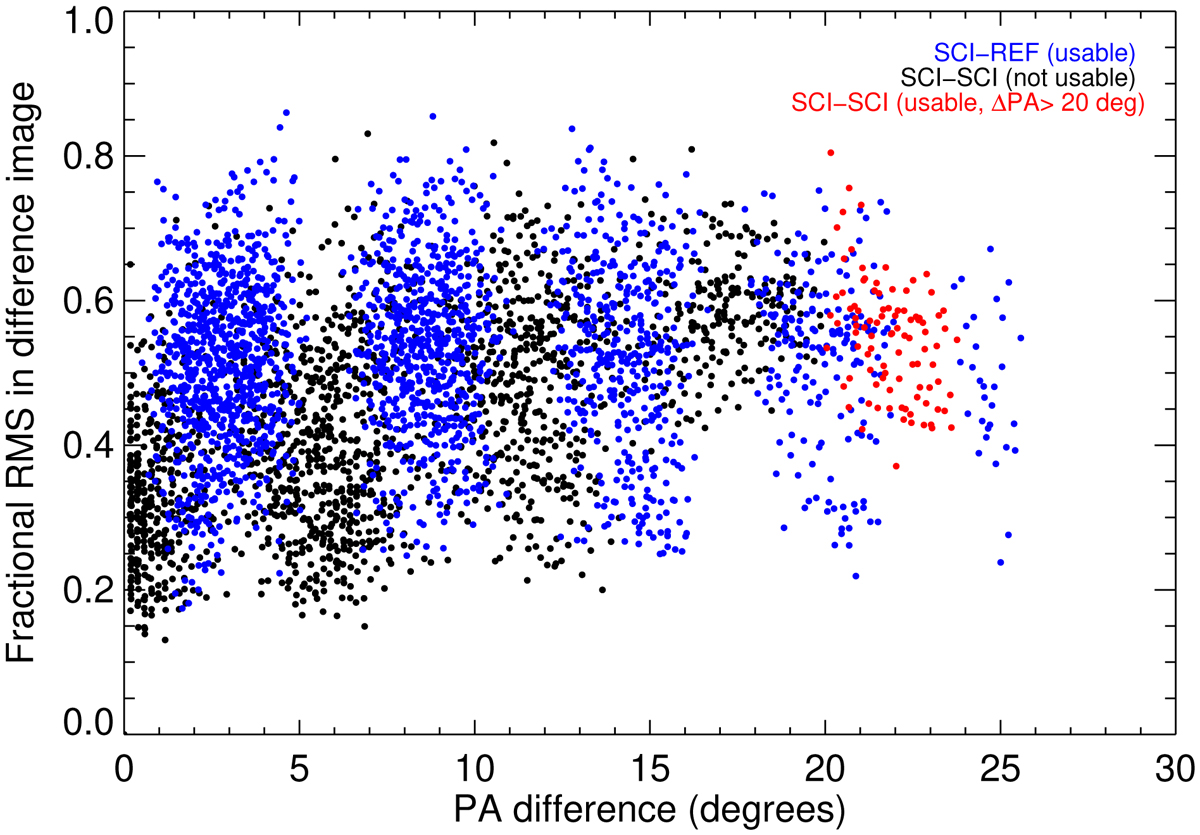
Comparison of PSF similarity between reference-science and science-science pairs. The residual fractional rms of difference images are plotted as a function of relative PA/rotational offset. The black dots represent science-science subtractions, the blue dots represent science-reference subtractions, and the red dots represent science-science differences with acceptable self-subtraction. For the science-reference points, the relevant quantity is the time difference, which has an almost linear relationship to the PA difference.
Current usage metrics show cumulative count of Article Views (full-text article views including HTML views, PDF and ePub downloads, according to the available data) and Abstracts Views on Vision4Press platform.
Data correspond to usage on the plateform after 2015. The current usage metrics is available 48-96 hours after online publication and is updated daily on week days.
Initial download of the metrics may take a while.