Fig. 3.
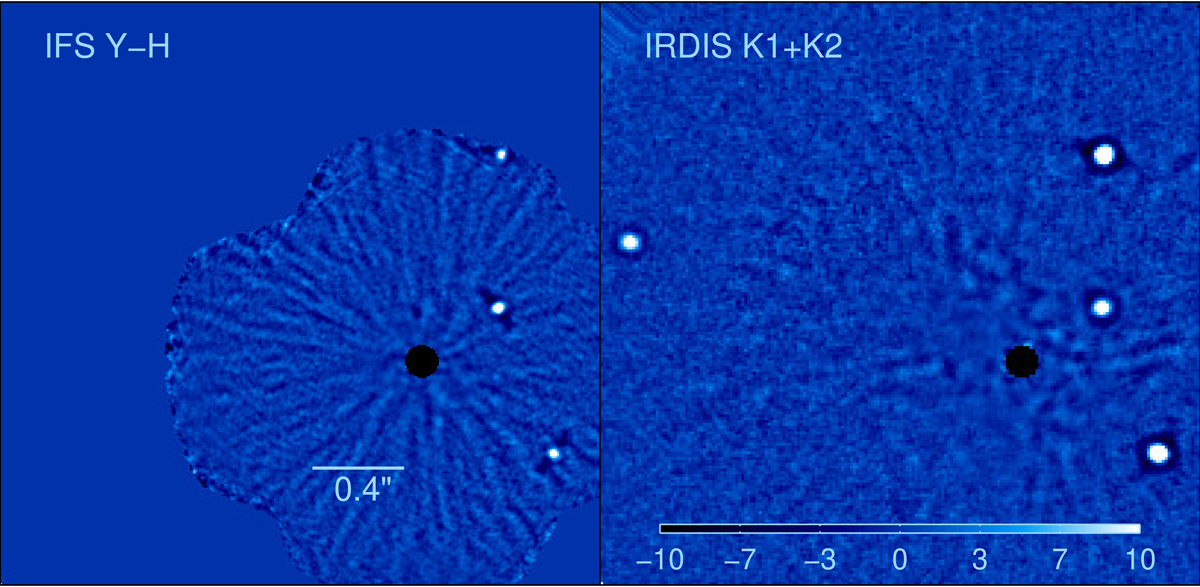
IFS and IRDIS images from star-hopping RDI reductions shown with same scale and orientation (North is up, east is left). Left: S/N map of the IFS Y–H band reduced image, showing only the real planets. The azimuthal filtering creates the dark negative arcs around the planets. They are more pronounced in the IFS reduction because more images were combined than for the IRDIS reduction. Right: S/N map of the IRDIS K1 + K2 band reduced image, showing only the real planets. The star, at the center of the black circle, is masked by the coronagraph. No new planets are detected in the newly probed region around 0.1″ separation above the contrast limit of 11.2 mag.
Current usage metrics show cumulative count of Article Views (full-text article views including HTML views, PDF and ePub downloads, according to the available data) and Abstracts Views on Vision4Press platform.
Data correspond to usage on the plateform after 2015. The current usage metrics is available 48-96 hours after online publication and is updated daily on week days.
Initial download of the metrics may take a while.