Free Access
Fig. 6
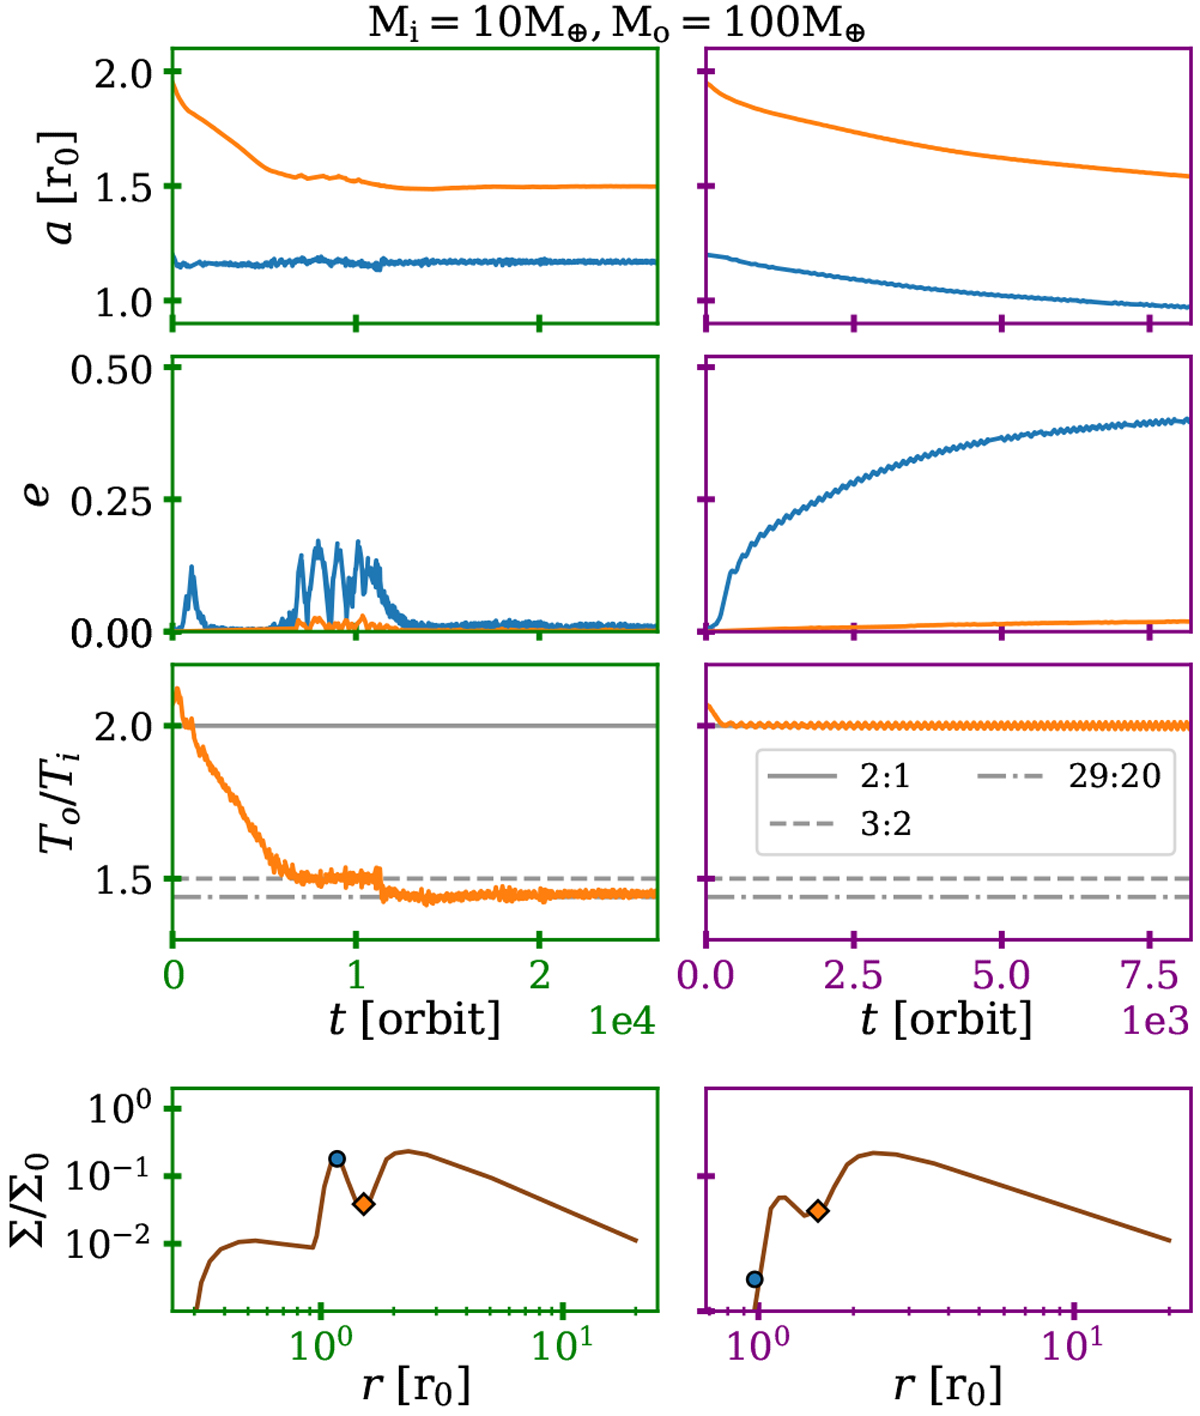
Top rows: same as Fig. 4, but for the 2p100 model. Last row: final surface density. The locations of the planets are indicated by markers, whose colours correspond to the top panels.
Current usage metrics show cumulative count of Article Views (full-text article views including HTML views, PDF and ePub downloads, according to the available data) and Abstracts Views on Vision4Press platform.
Data correspond to usage on the plateform after 2015. The current usage metrics is available 48-96 hours after online publication and is updated daily on week days.
Initial download of the metrics may take a while.