Free Access
Fig. 28
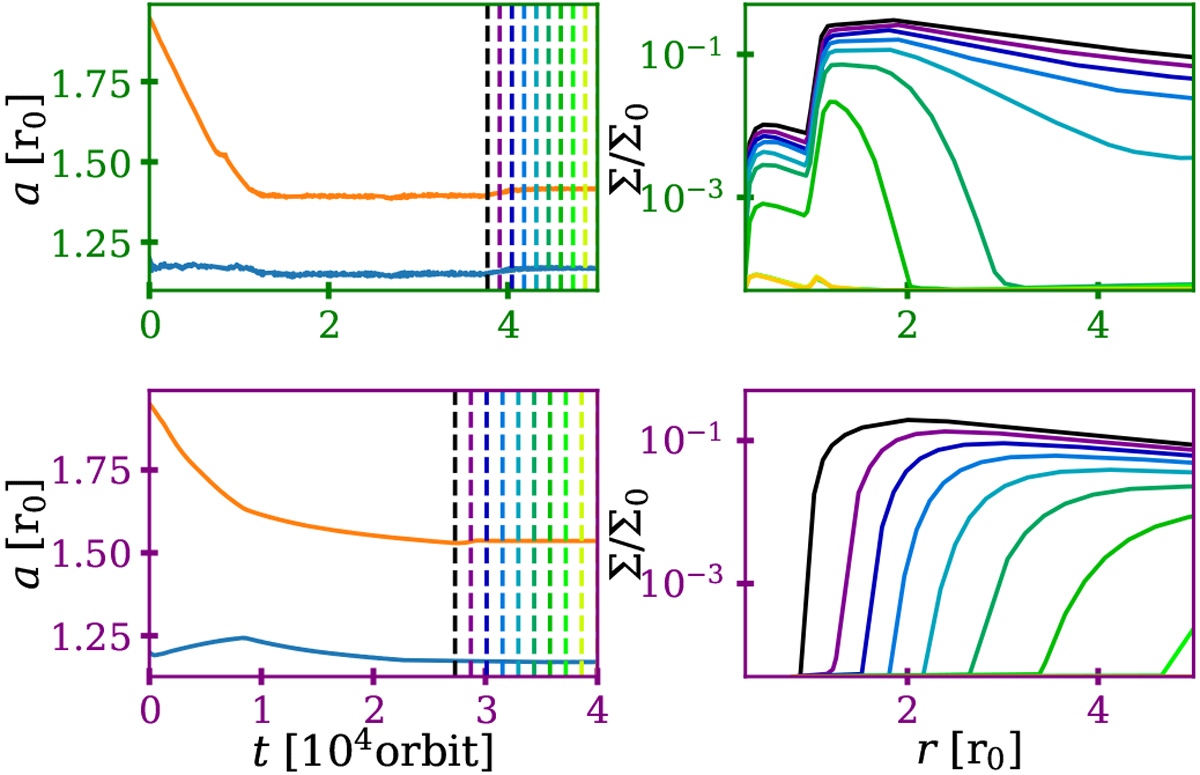
Time evolution of models 2p20 after photo-evaporation is activated. Left panels: semi-major axes of the planets. Right panels: surface density evolution of the disc. The vertical lines in the left panels correspond to the time when the surface densities are plotted.
Current usage metrics show cumulative count of Article Views (full-text article views including HTML views, PDF and ePub downloads, according to the available data) and Abstracts Views on Vision4Press platform.
Data correspond to usage on the plateform after 2015. The current usage metrics is available 48-96 hours after online publication and is updated daily on week days.
Initial download of the metrics may take a while.