Free Access
Fig. 25
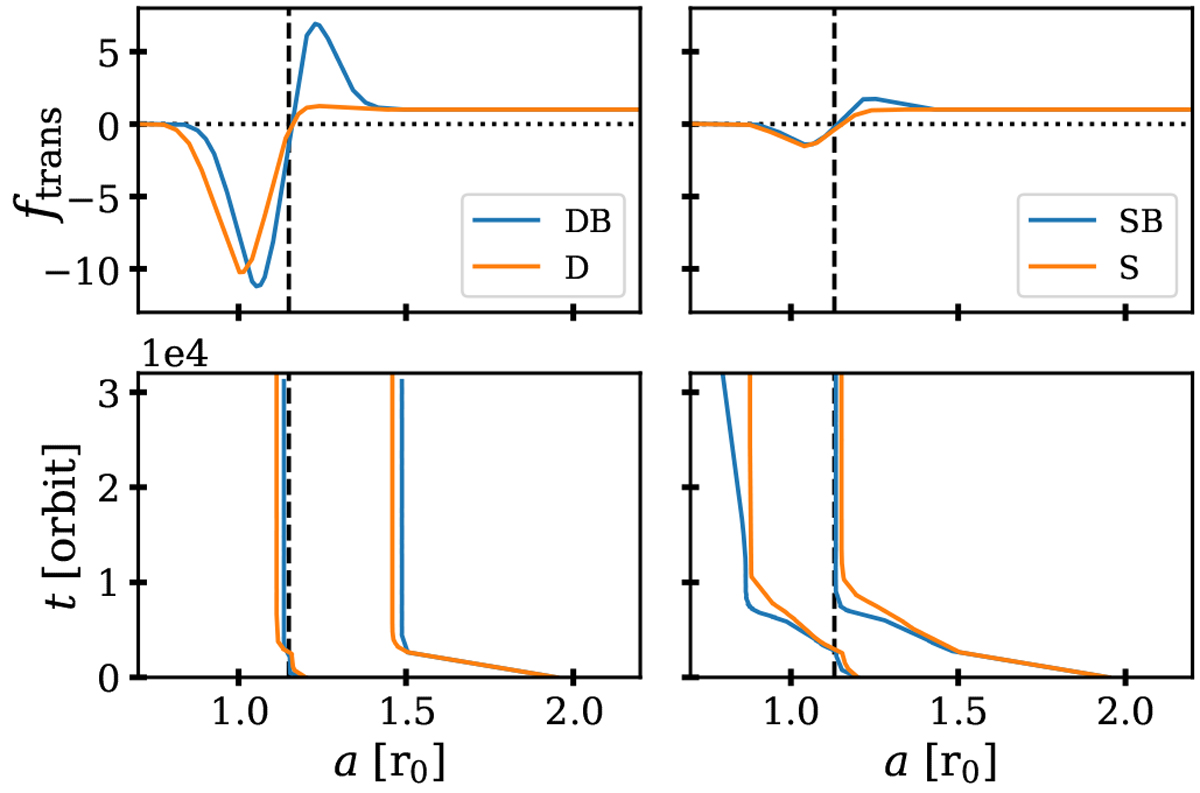
Results of four N-body simulations in which a migration timescale transition zone, as depicted with the same colour as in the top panels, is used. The vertical dashed line corresponds to ftrans = 0, and marks the transition from positive to negative migration.
Current usage metrics show cumulative count of Article Views (full-text article views including HTML views, PDF and ePub downloads, according to the available data) and Abstracts Views on Vision4Press platform.
Data correspond to usage on the plateform after 2015. The current usage metrics is available 48-96 hours after online publication and is updated daily on week days.
Initial download of the metrics may take a while.