Fig. 22
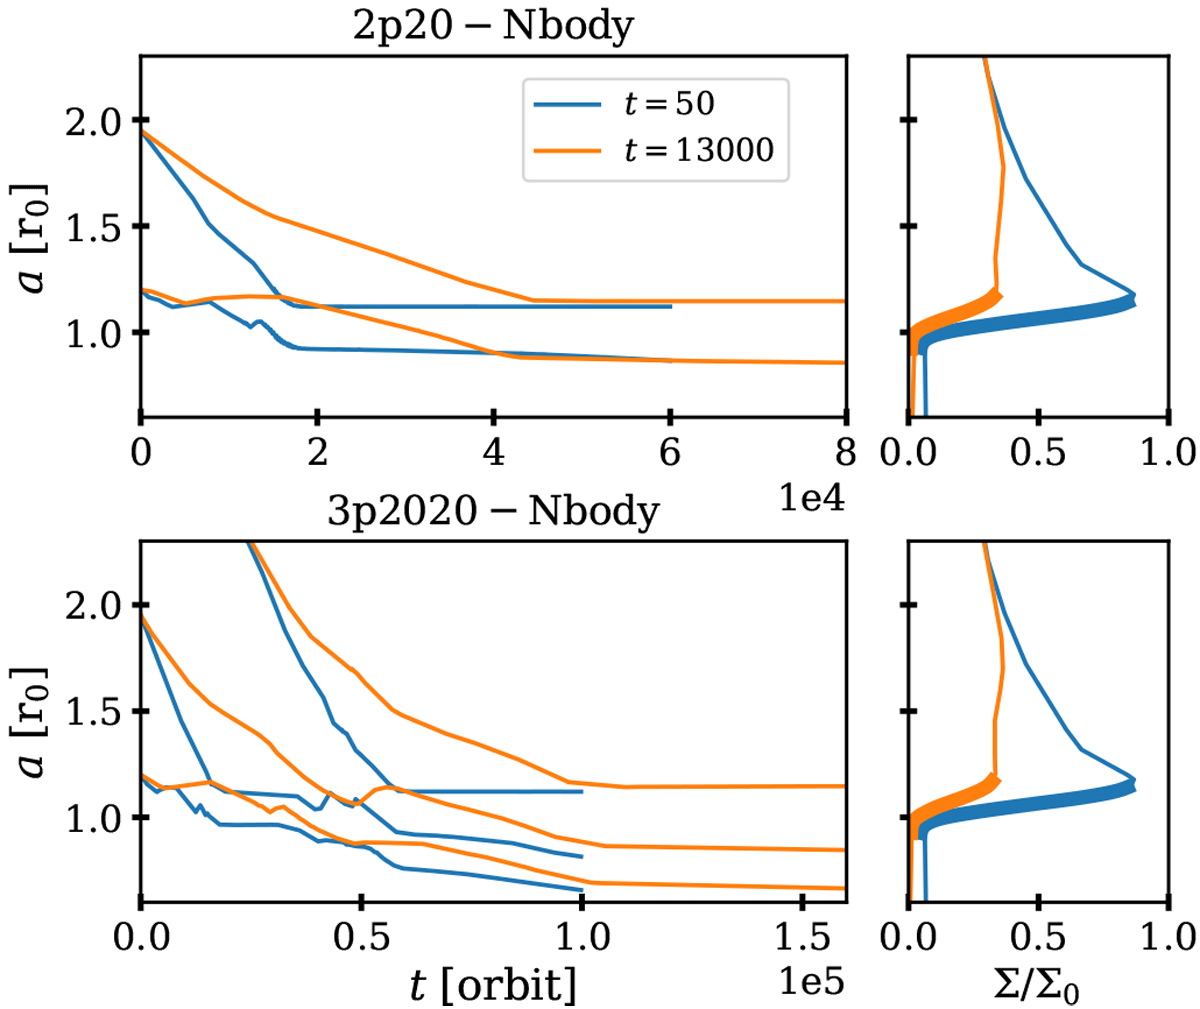
Surface density in the horizontal axis and distance from the star on the vertical (right panel). The surface density profiles at t = 50 and t = 13 000 orbit are denoted by blue and orange. The thick sections represent the areas in which the torque on a 10 M⊕ circular planet is positive. Results of N-body simulations for the initial conditions as 2p20 (top left) and 3p2020 (bottom left) DZ models. The colours correspond to the surface density profiles shown in the right panels. The push by the outer planet in each pair can shove the inner planet out of the trapping point.
Current usage metrics show cumulative count of Article Views (full-text article views including HTML views, PDF and ePub downloads, according to the available data) and Abstracts Views on Vision4Press platform.
Data correspond to usage on the plateform after 2015. The current usage metrics is available 48-96 hours after online publication and is updated daily on week days.
Initial download of the metrics may take a while.