Fig. 2
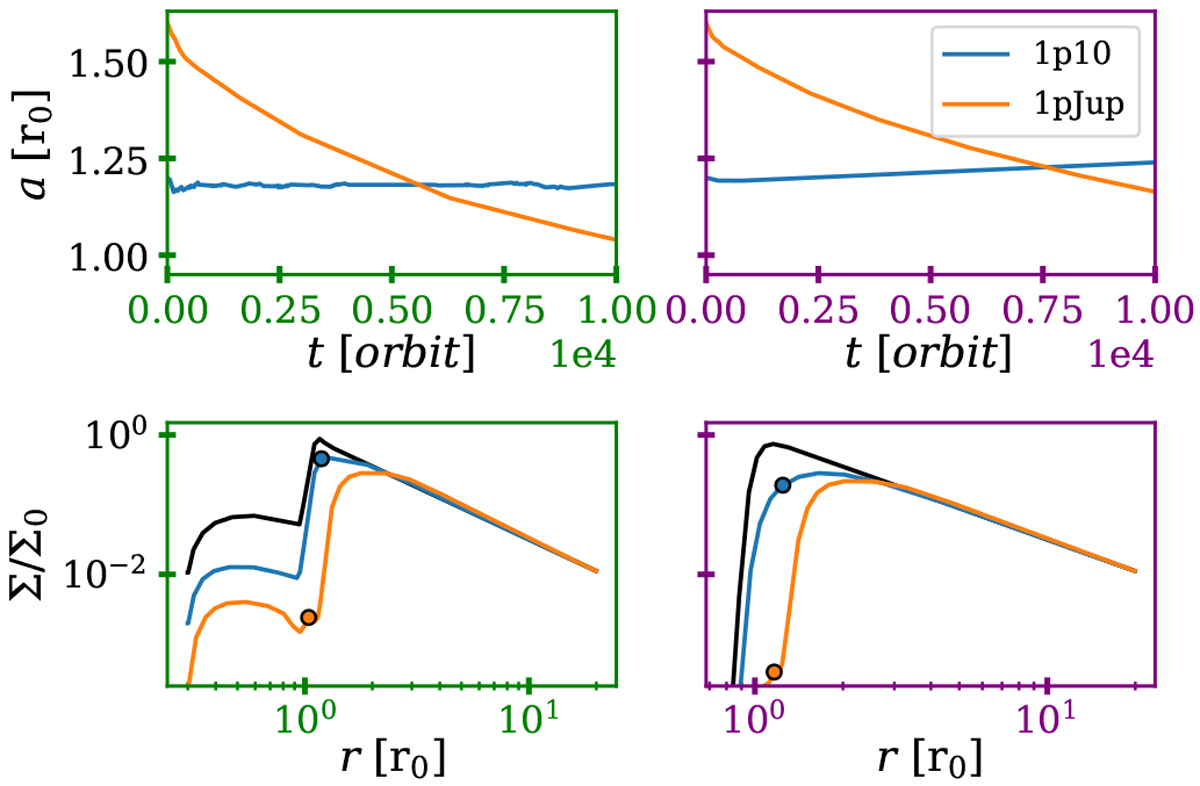
Evolution of a single planet in a disc with a DZ (left) and at the IB (right). Top: migration path, a(t). In each panel, every line belongs to a separate simulation with only one planet. Bottom: surface density profiles at t = 50 (black), when the full potential of the planet is applied on the disc, and t = 104 orbit. The colour code is the same as for the top row and the final locations of the planets are marked by circles. The low-mass planet is trapped the DZ model and slowly migrates outwards in the IB model. In contrast, the massive planet (Jupiter mass) continues its migration to the inner disc because of the deformation of the bump by its gap.
Current usage metrics show cumulative count of Article Views (full-text article views including HTML views, PDF and ePub downloads, according to the available data) and Abstracts Views on Vision4Press platform.
Data correspond to usage on the plateform after 2015. The current usage metrics is available 48-96 hours after online publication and is updated daily on week days.
Initial download of the metrics may take a while.