Fig. 19
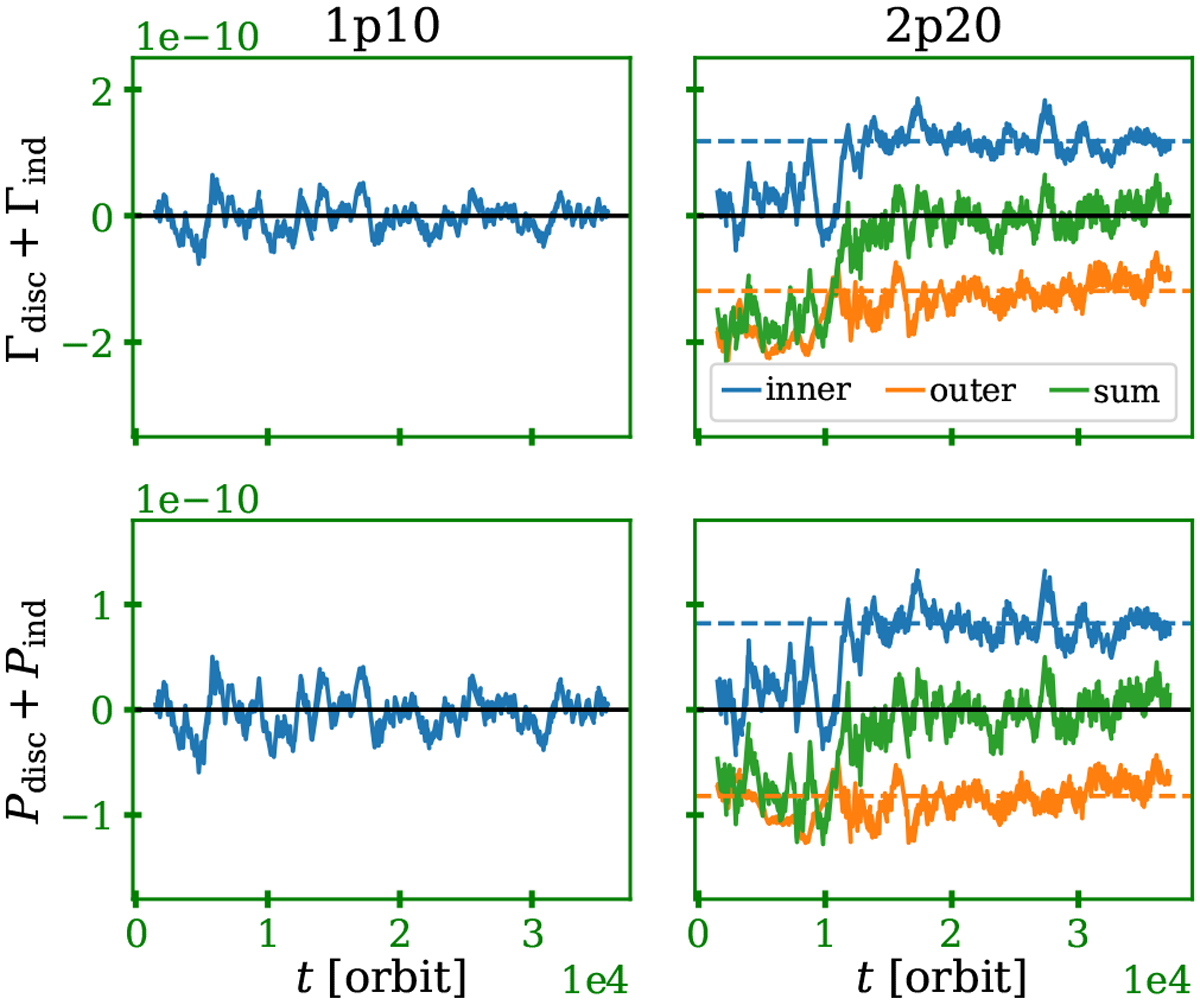
Total torque (top row) and total power (bottom row). These quantities for a single planet of the 1p10 DZ model are shown in the left column and for the 2p20 model are shown in the right column. The dark green line represents the total torque or power on the system. The horizontal black lines in each panel marks zero. The contribution of the indirect term is included in the plotted quantities. Torques and powers are averaged over 1000 orbits to decrease the oscillations created by the vortices and eccentricities of the planets. The dashed lines in the right panels correspond to the values of the eccentricity and semi-major axis damping timescales used in the supporting N-body simulations, as displayed in Fig. 20.
Current usage metrics show cumulative count of Article Views (full-text article views including HTML views, PDF and ePub downloads, according to the available data) and Abstracts Views on Vision4Press platform.
Data correspond to usage on the plateform after 2015. The current usage metrics is available 48-96 hours after online publication and is updated daily on week days.
Initial download of the metrics may take a while.