Fig. 10
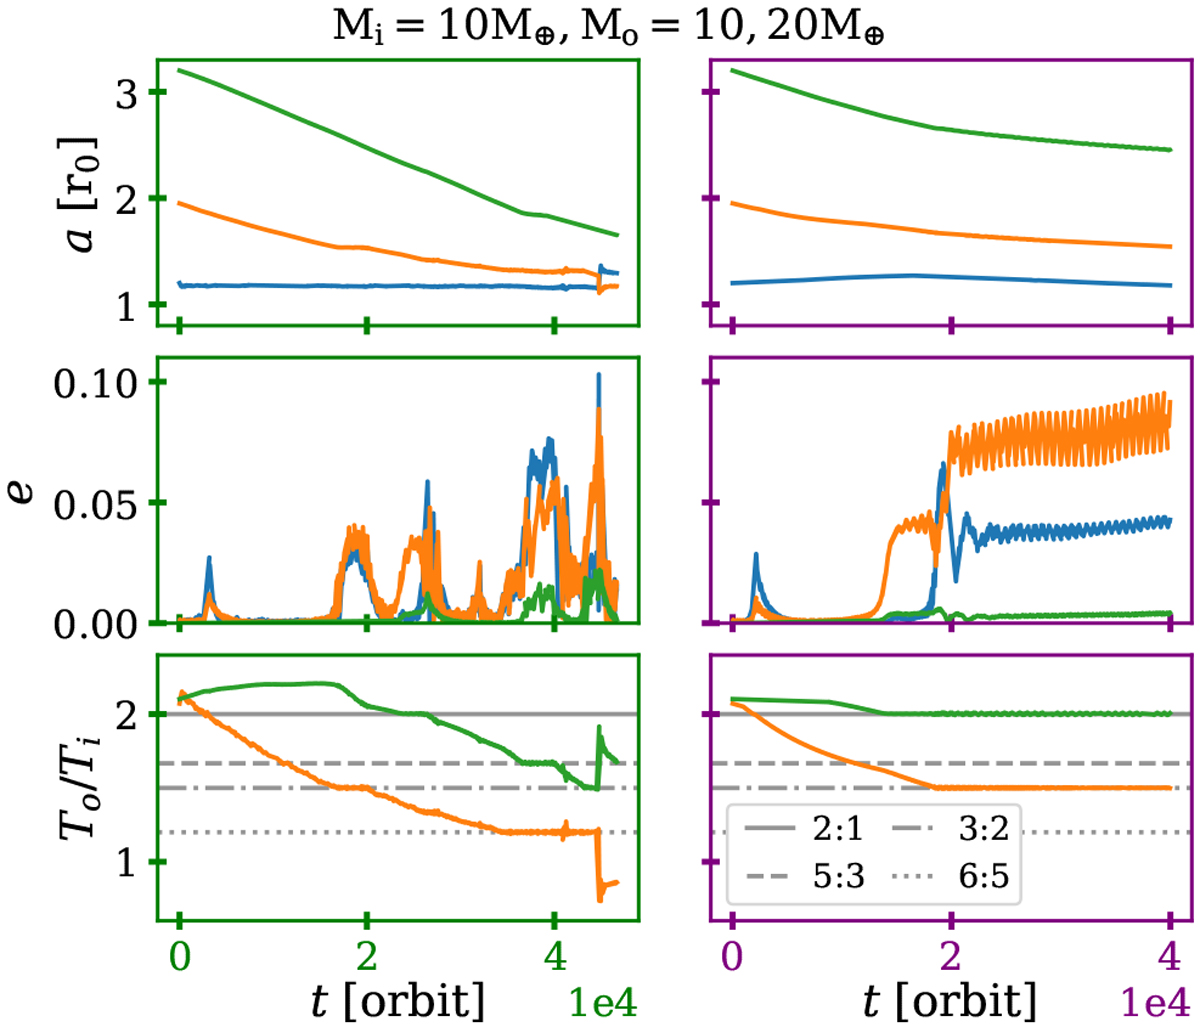
Semi-major axis and eccentricity for 3p1020 models (top and middle panels). Bottom panels: orbital period ratio for each consecutive pair of planets, where the colour corresponds to the outer planet. For example, the green curve demonstrates the orbital period ratio of the third planet to the second planet from the inside out.
Current usage metrics show cumulative count of Article Views (full-text article views including HTML views, PDF and ePub downloads, according to the available data) and Abstracts Views on Vision4Press platform.
Data correspond to usage on the plateform after 2015. The current usage metrics is available 48-96 hours after online publication and is updated daily on week days.
Initial download of the metrics may take a while.