Fig. 1
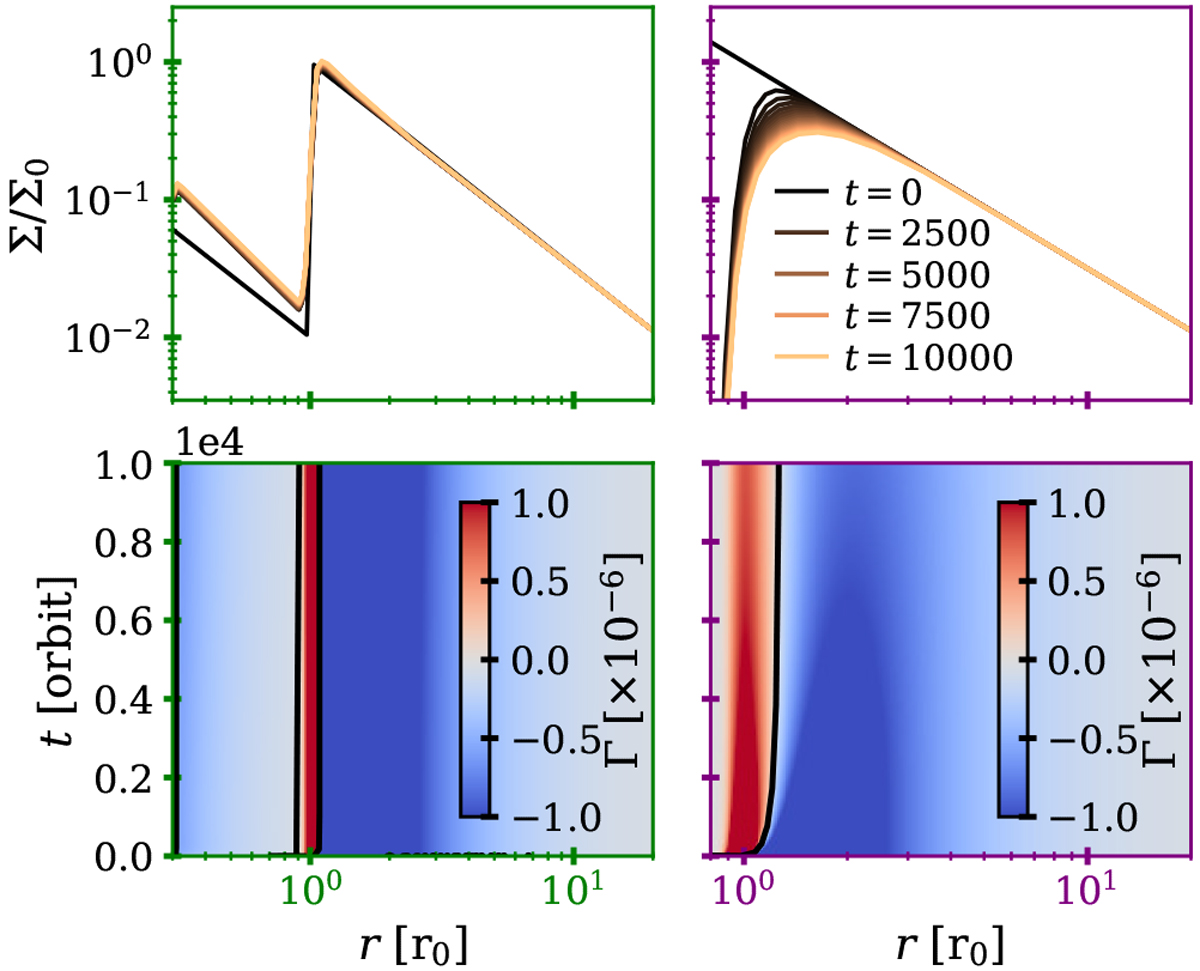
Evolution of the disc without any embedded planets for the two types of trap, DZ (left) and IB (right). Top: 1D surface density evolution. The colour of the lines represents the time in units of the orbital period at r = 1. Black denotes the initial profile, and the line colours pale as time proceeds. Bottom: analytical type I torque acting on a planet with ten Earth masses calculated using the disc profiles. Every horizontal line in these plots shows the specific torque at every distance from the star at a given time. The black contours represent the zero-torque locations.
Current usage metrics show cumulative count of Article Views (full-text article views including HTML views, PDF and ePub downloads, according to the available data) and Abstracts Views on Vision4Press platform.
Data correspond to usage on the plateform after 2015. The current usage metrics is available 48-96 hours after online publication and is updated daily on week days.
Initial download of the metrics may take a while.