Fig. C.1
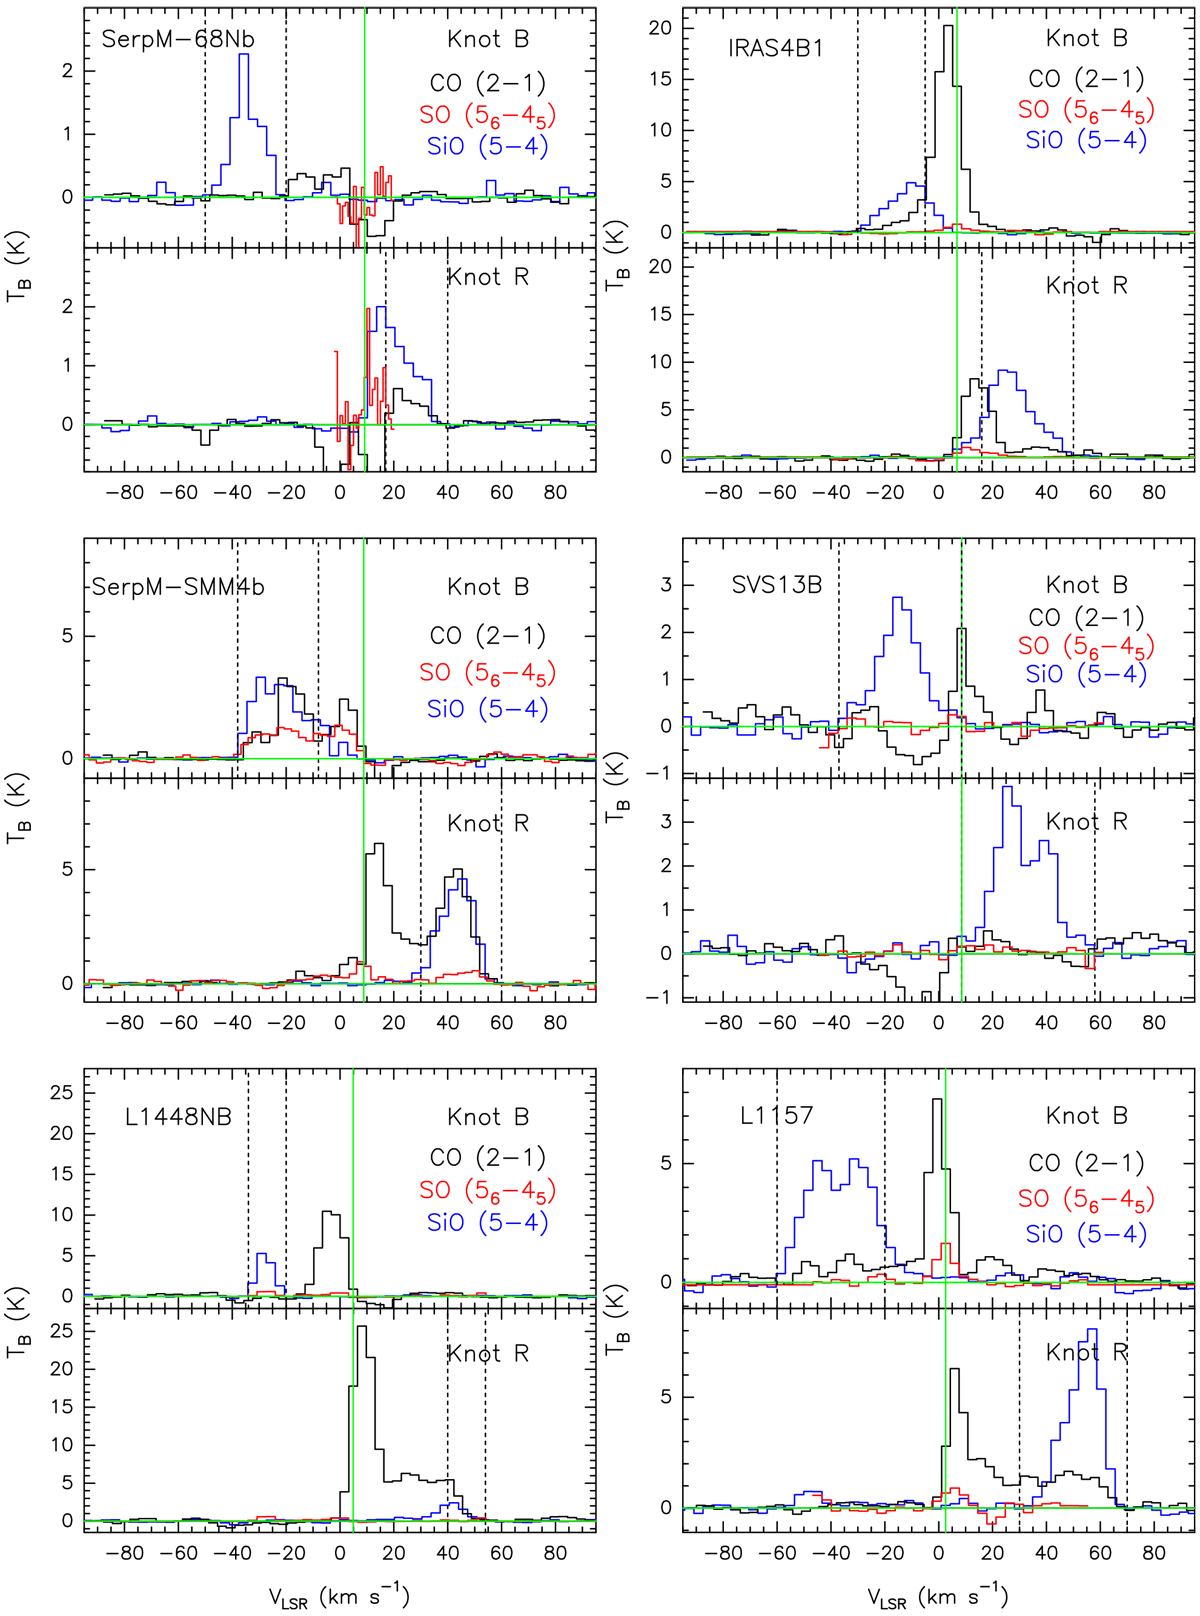
Spectra of CO (black), SO (red), and SiO (blue) for the 12 sources driving an SiO jet which are listed in Table 3. For each source, the upper and lower panels show the spectra extracted at the position of the blue-shifted and red-shifted SiO knots located closest to the driving source, B and R. The source name is labeled in the top-left corner, and the sources are ordered by increasing internal luminosity (Lint). The horizontal and vertical green lines indicate the baseline and systemic velocity, Vsys, as listed in Table 1. The vertical black dotted lines indicate the high-velocity range over which the line intensity is integrated, as reported in Table 4.
Current usage metrics show cumulative count of Article Views (full-text article views including HTML views, PDF and ePub downloads, according to the available data) and Abstracts Views on Vision4Press platform.
Data correspond to usage on the plateform after 2015. The current usage metrics is available 48-96 hours after online publication and is updated daily on week days.
Initial download of the metrics may take a while.