Fig. 7
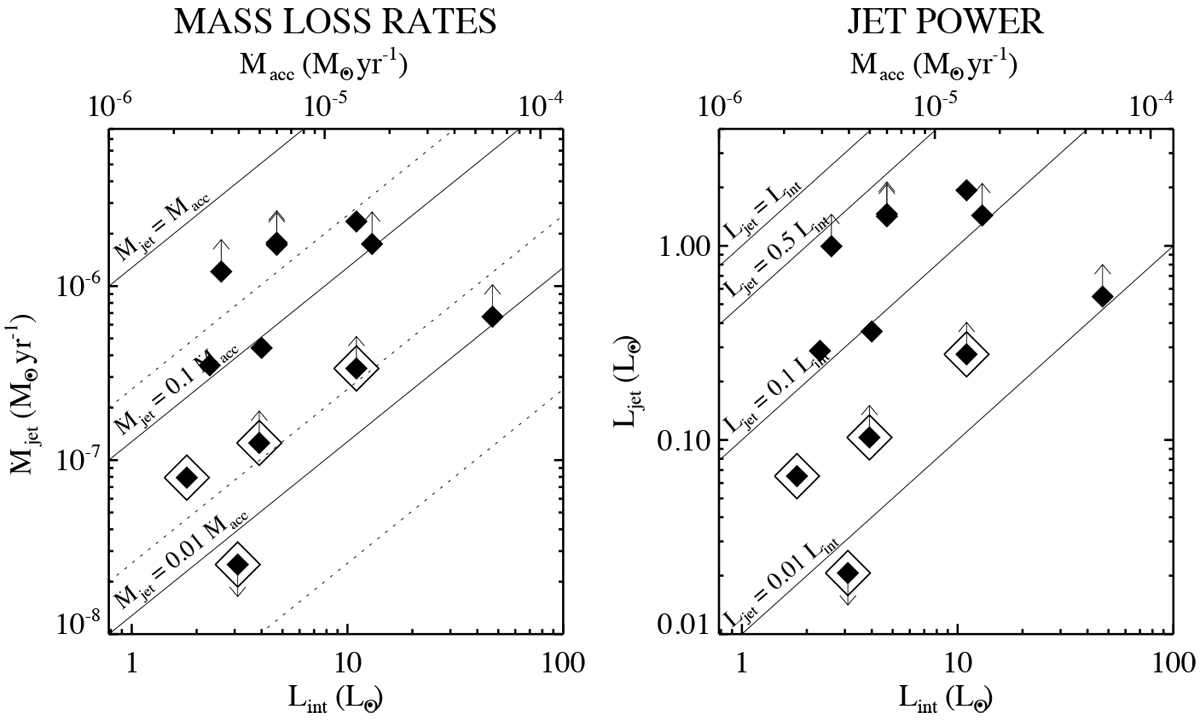
Two-sided jet mass-loss rates (Ṁjet in M⊙ yr−1, left), and jet mechanical luminosities (Ljet in L⊙, right) versusthe source internal luminosity (Lint in L⊙). The values are inferred for the 12 Class 0 protostars driving an SiO jet detected at > 10σ in the integrated maps (see Table 3). Ṁjet and Ljet are the sum over the closest blue- and red-shifted SiO knots, B and R (see Tables 4 and 5). Lower and upper limits are indicated by upward and downward arrows. The jet knots where no CO is detected (the “CO-poor” jets) are indicated by larger empty diamonds. For the jets with only one “CO-poor” lobe, the total Ṁjet and Ljet is dominated by the estimate obtained for the other lobe, hence, they show up as a firm value or lower limit (depending if CO in the other lobe is optically thin or thick). The exception is SVS13B for whichno CO is detected in both lobes, hence, only an upper limit is derived for the total Ṁjet and Ljet. The black lines in the left panel indicate Ṁjet = [0.01, 0.1, 1] × Ṁacc, with Ṁacc estimated from Lint, assuming a protostellar mass of 0.05 M⊙ or 0.25 M⊙ (solid and dotted lines, respectively). The Ṁacc values labeled on the upper x-axis correspond to M* = 0.05 M⊙. The black solid lines in the right panel indicate Ljet = [0.01, 0.1, 0.5, 1] × Lint.
Current usage metrics show cumulative count of Article Views (full-text article views including HTML views, PDF and ePub downloads, according to the available data) and Abstracts Views on Vision4Press platform.
Data correspond to usage on the plateform after 2015. The current usage metrics is available 48-96 hours after online publication and is updated daily on week days.
Initial download of the metrics may take a while.