Fig. 6
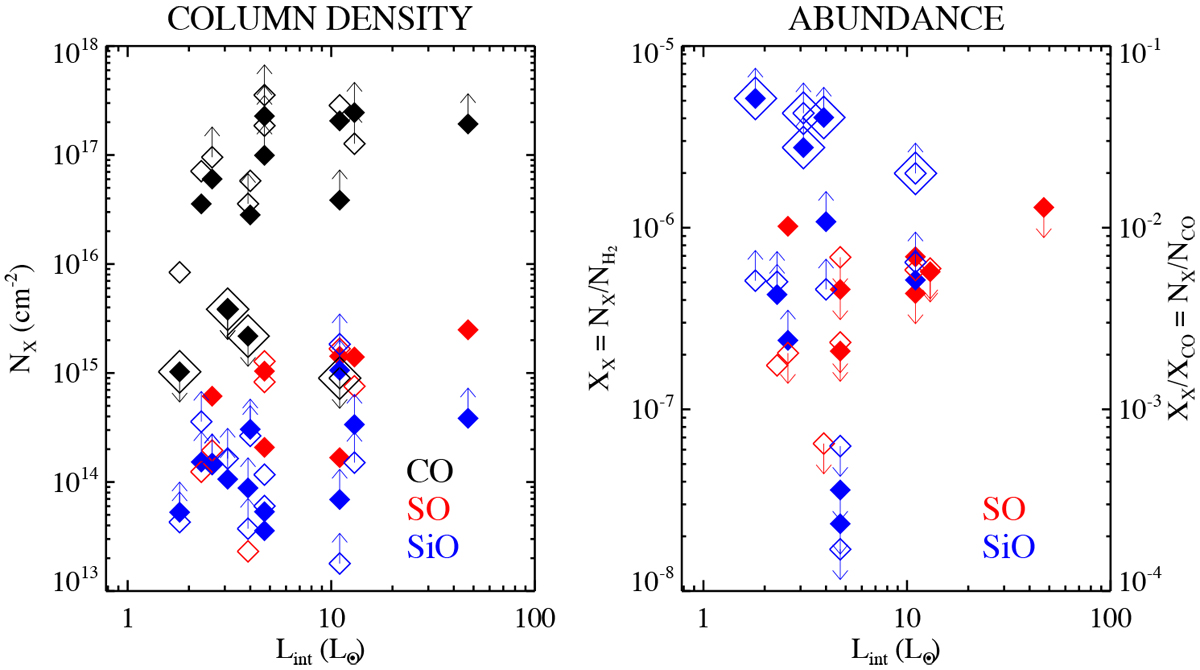
Beam-averaged column densities (NX in cm−2, left), and SO and SiO abundances (right) versus the source internal luminosity (Lint in L⊙). Molecular abundances are with respect to H2 on the left axis (assuming [CO]/[H2] = 10−4) and with respect to CO on the right axis. The values are inferred for the 12 Class 0 protostars driving an SiO jet detected at > 10σ in the integrated maps (see Table 3) at the position of the closest blue- and red-shifted SiO knots, B and R (filled and empty small diamonds, respectively; see Tables 4 and 5). Black, red, and blue symbols are for CO, SO, and SiO, respectively. Lower and upper limits are indicated by upward and downward arrows. The jet knots where no CO is detected (the “CO-poor” jets) are indicated by larger empty diamonds. For these knots we derive upper limits on NCO, and lower limits on XSiO.
Current usage metrics show cumulative count of Article Views (full-text article views including HTML views, PDF and ePub downloads, according to the available data) and Abstracts Views on Vision4Press platform.
Data correspond to usage on the plateform after 2015. The current usage metrics is available 48-96 hours after online publication and is updated daily on week days.
Initial download of the metrics may take a while.