Fig. 5
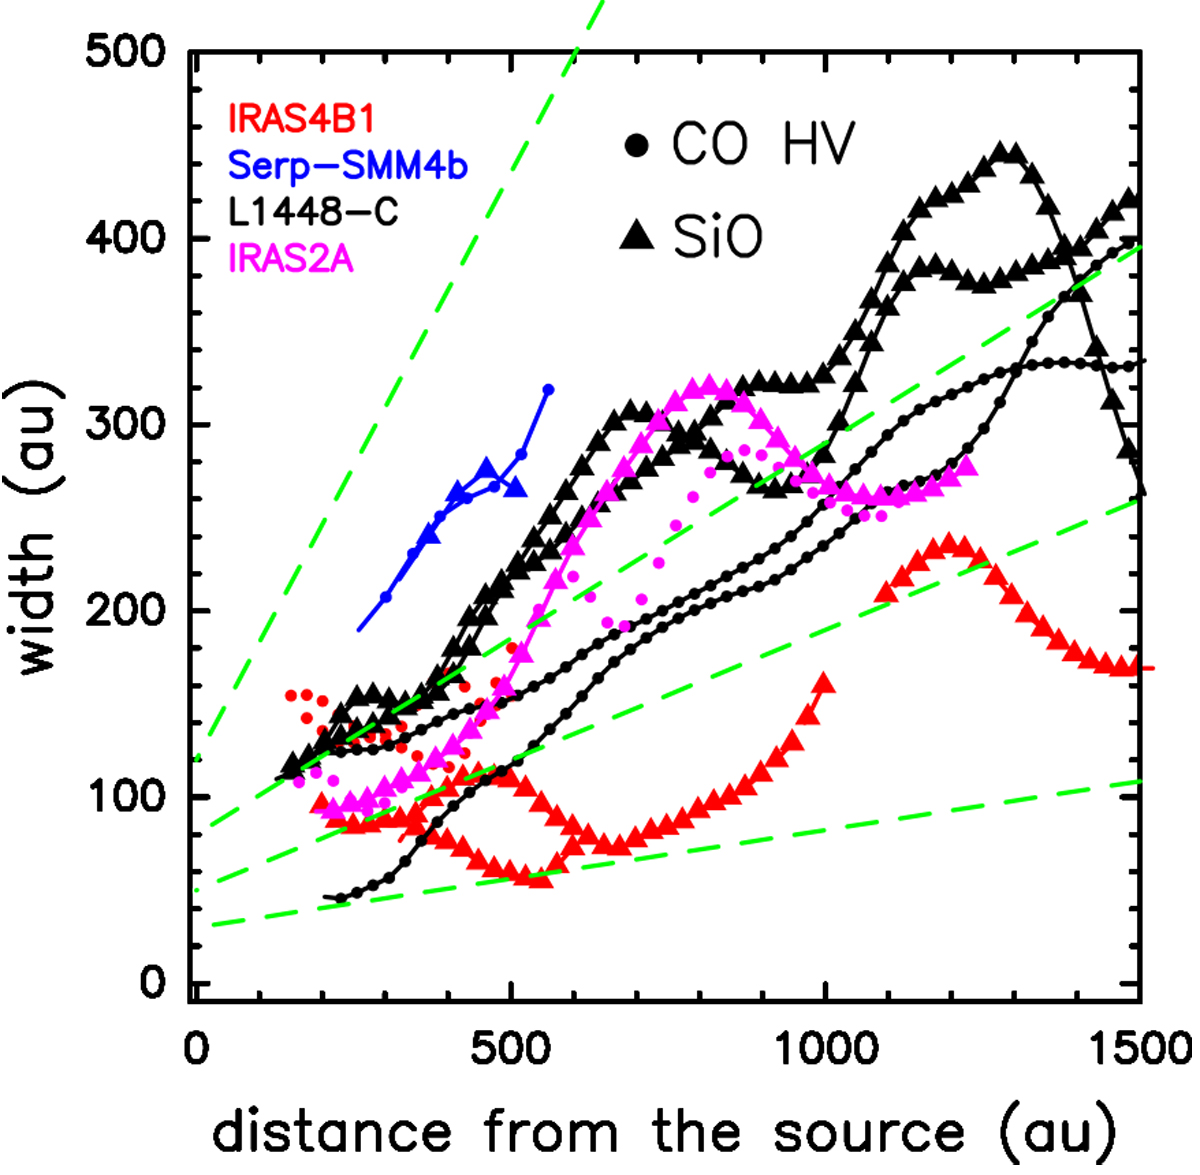
Deconvolved widths (2Rjet) of SiO (triangles) and high-velocity CO (dots) emission (high-velocity intervals defined in Table 4). Only the jet lobes where both SiO and high-velocity CO are detected above 10 σ at the same positions along the jet are plotted. Colors code the sources. At high velocity, the CO emission appears as collimated as the SiO jet emission. Green dashed lines correspond to straight lines with full opening angles of α = 3°, 8°, 12°, and 35° and initial width of 30, 50, 80, and 120 au outlining the collimation properties of the flow.
Current usage metrics show cumulative count of Article Views (full-text article views including HTML views, PDF and ePub downloads, according to the available data) and Abstracts Views on Vision4Press platform.
Data correspond to usage on the plateform after 2015. The current usage metrics is available 48-96 hours after online publication and is updated daily on week days.
Initial download of the metrics may take a while.