Free Access
Fig. 3
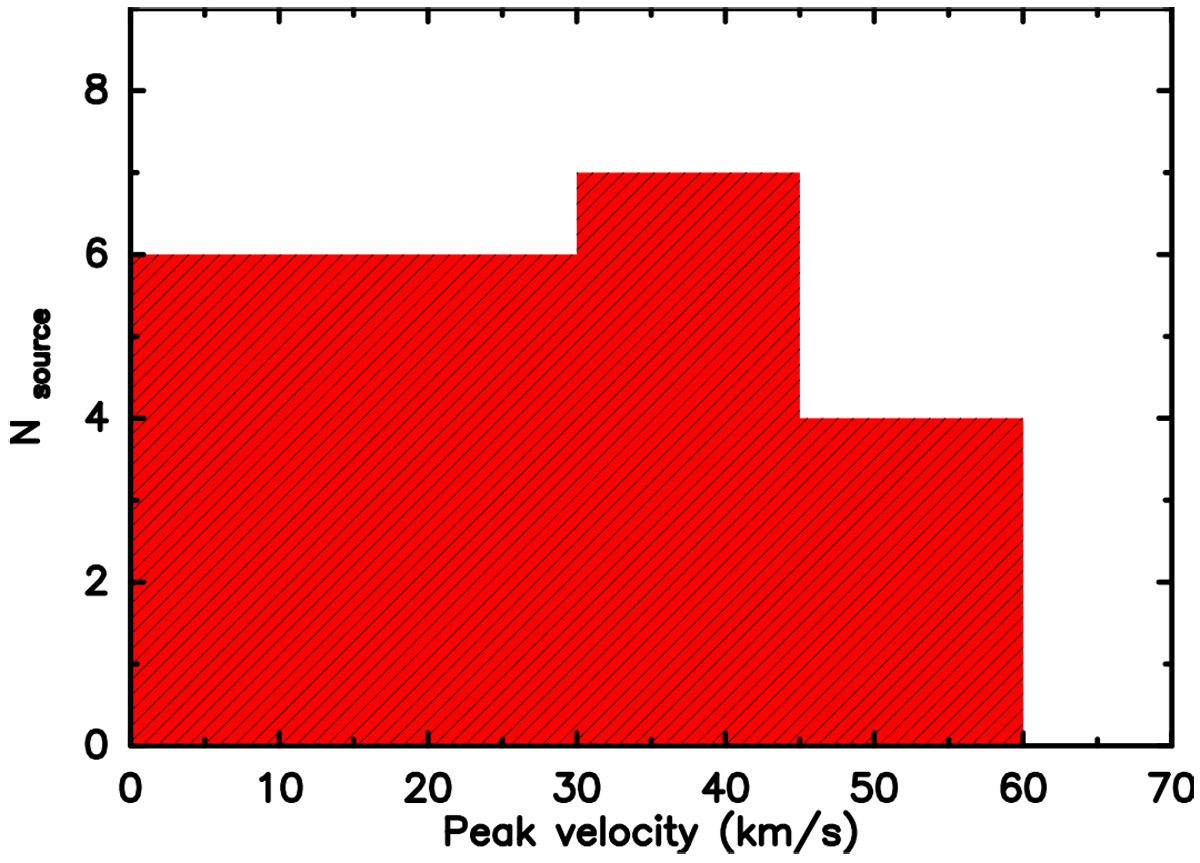
Distribution of jet radial velocities in the CALYPSO sample. The values correspond to the velocity of the SiO emission peak in the spectra extracted at the position of the blue- and red-shifted SiO knots close to the driving protostar, B and R (see Fig. C.1).
Current usage metrics show cumulative count of Article Views (full-text article views including HTML views, PDF and ePub downloads, according to the available data) and Abstracts Views on Vision4Press platform.
Data correspond to usage on the plateform after 2015. The current usage metrics is available 48-96 hours after online publication and is updated daily on week days.
Initial download of the metrics may take a while.