Fig. 2
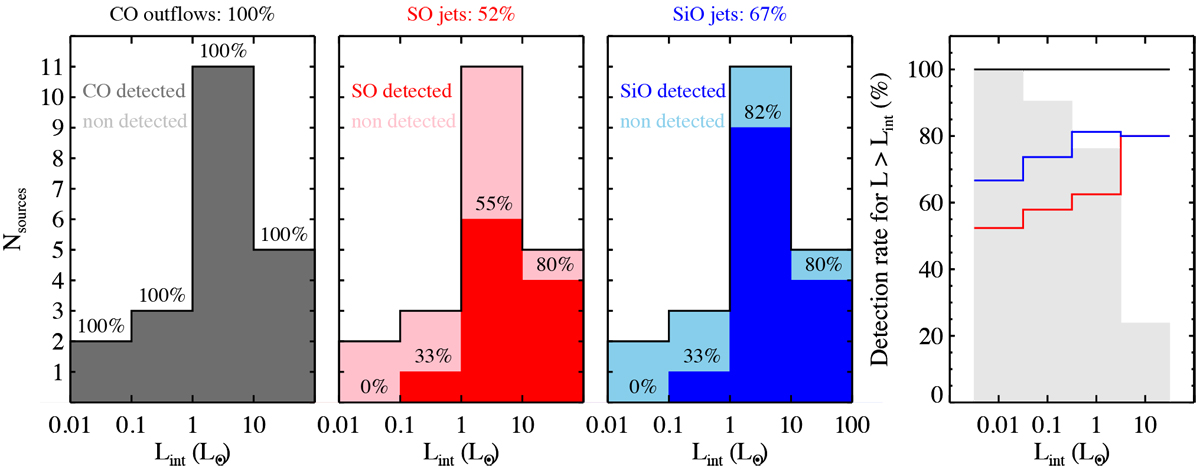
Number of sources associated with outflows and jets as traced by CO (2− 1) (black, left), SO (56−45) (red, middle-left), and SiO (5−4) (blue, middle-right) as a function of the internal luminosity, Lint, of the 21 Class 0 protostars in the CALYPSO sample. The detection rate for each Lint bin (in logarithmic scale) is reported above the histogram, while the detection rate for the whole sample is labeled on top of each panel. The detection rate of jets and outflows for L > Lint is shown in the right panel, with the same colour coding. The grey histogram shows the fraction of sources for L > Lint.
Current usage metrics show cumulative count of Article Views (full-text article views including HTML views, PDF and ePub downloads, according to the available data) and Abstracts Views on Vision4Press platform.
Data correspond to usage on the plateform after 2015. The current usage metrics is available 48-96 hours after online publication and is updated daily on week days.
Initial download of the metrics may take a while.