Free Access
Fig. E.2
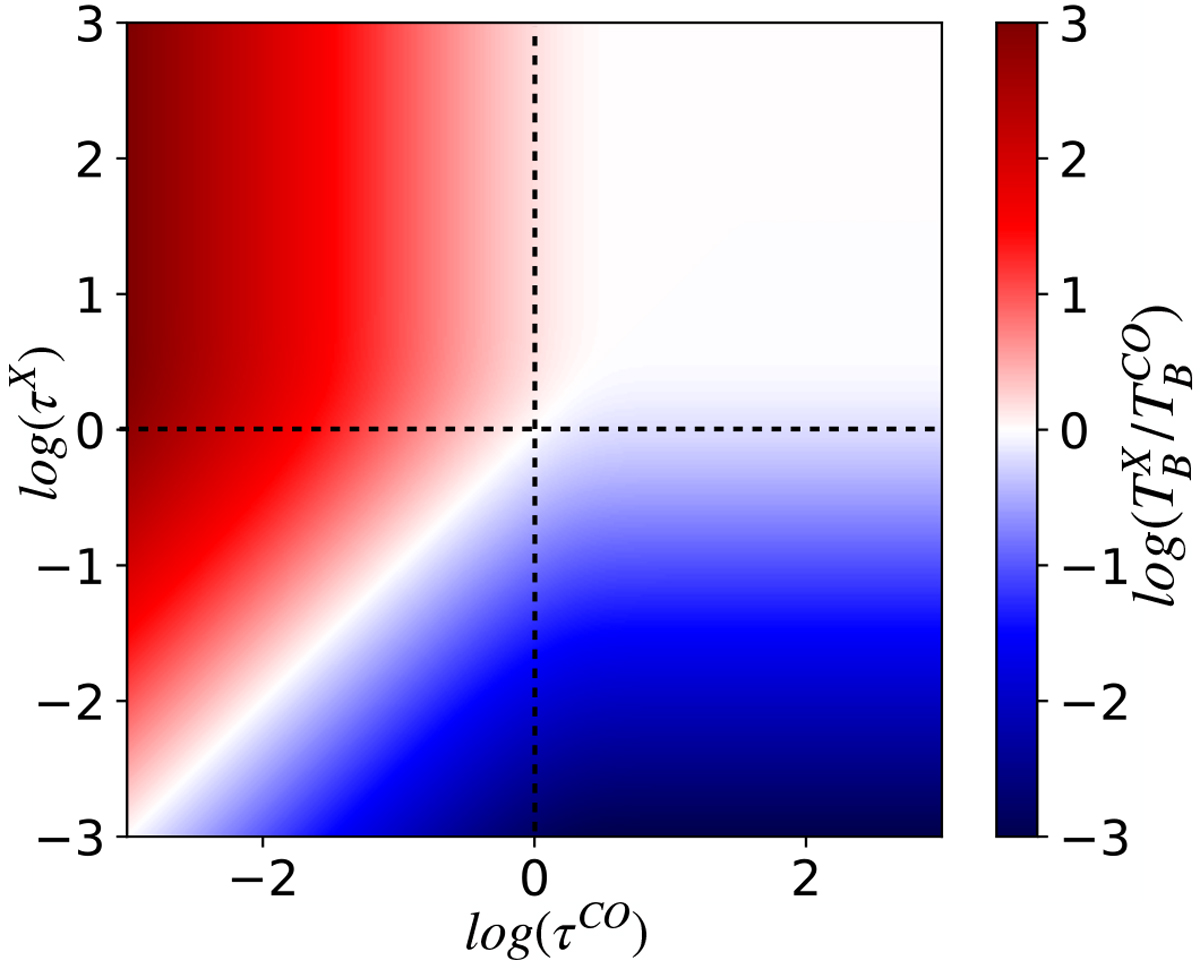
Line ratio as a function of the opacity of each line, τCO and τX, assuming that levels are in LTE at the same temperature. The dashed vertical line and the dashed horizontal line delimit the region where the CO line and the X line are optically thick, respectively. ![]() only if both lines are optically thick or if τX ≃ τCO.
only if both lines are optically thick or if τX ≃ τCO.
Current usage metrics show cumulative count of Article Views (full-text article views including HTML views, PDF and ePub downloads, according to the available data) and Abstracts Views on Vision4Press platform.
Data correspond to usage on the plateform after 2015. The current usage metrics is available 48-96 hours after online publication and is updated daily on week days.
Initial download of the metrics may take a while.