Fig. D.1
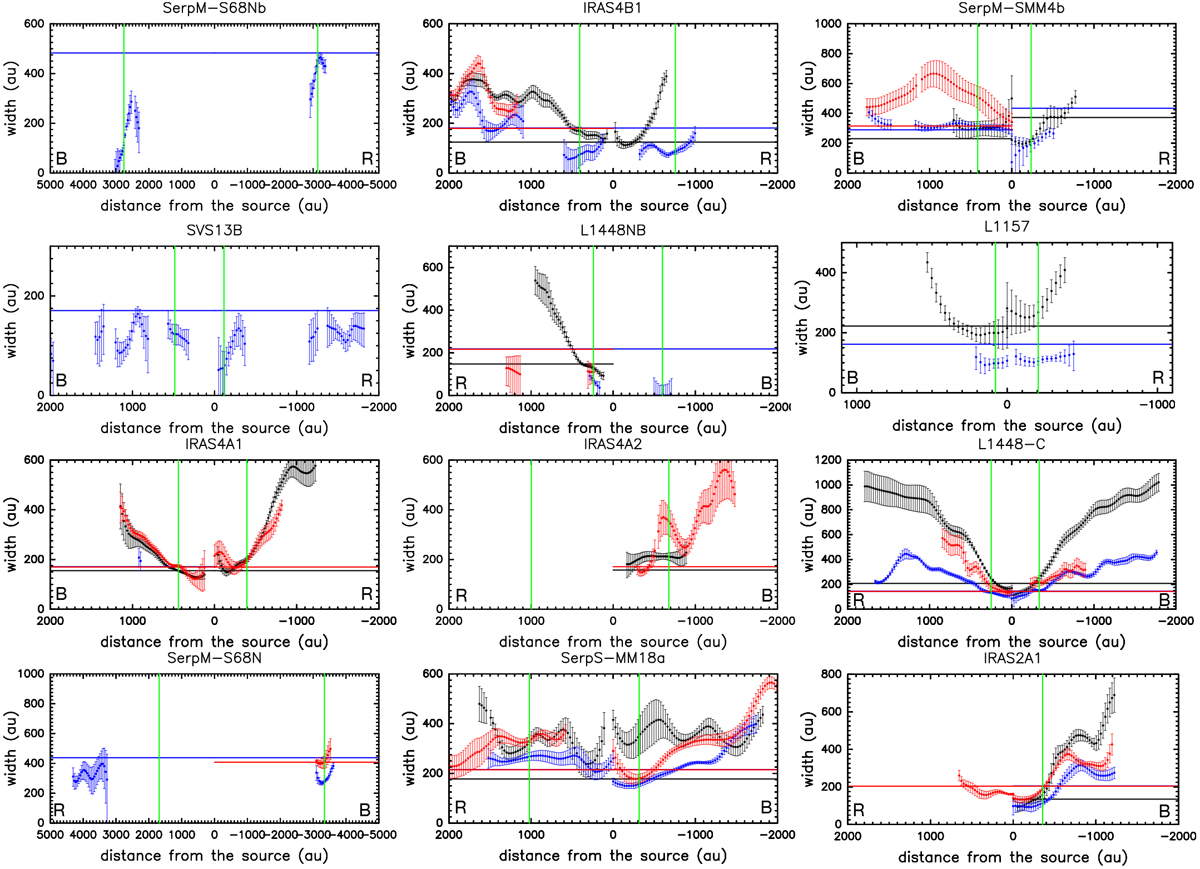
Deconvolved widths of the 12 jets detected in the CALYPSO sample within 5000 au from protostars. Widths of CO (2−1), SO (56 −45), and SiO (5−4) emission are plotted in black, red, and blue, respectively. The flow width has been measured only at the positions where the transverse profile shows a peak emission larger that 10σ. Flows which show spatially resolved structures strongly deviating from a Gaussian profile have been discarded. The positions of the blue- and red-shifted SiO knots located closest to the driving protostar, B and R, where the line spectra have been extracted (see Fig. C.1), are indicated by vertical green lines. No measurements of the width of the SiO emission at the position of the inner B and R knots is derived for the jets of IRAS4A1 and IRAS4A2, whose SiO emission is detected at > 10σ only atlarger distances from the protostar in the terminal bow shocks which are not located along the jet axis. The size of the beam transverse to the jet axis for CO (2− 1), SO (56 −45), and SiO (5−4) are indicated by black, red, and blue horizontal lines, respectively.
Current usage metrics show cumulative count of Article Views (full-text article views including HTML views, PDF and ePub downloads, according to the available data) and Abstracts Views on Vision4Press platform.
Data correspond to usage on the plateform after 2015. The current usage metrics is available 48-96 hours after online publication and is updated daily on week days.
Initial download of the metrics may take a while.