Fig. 1
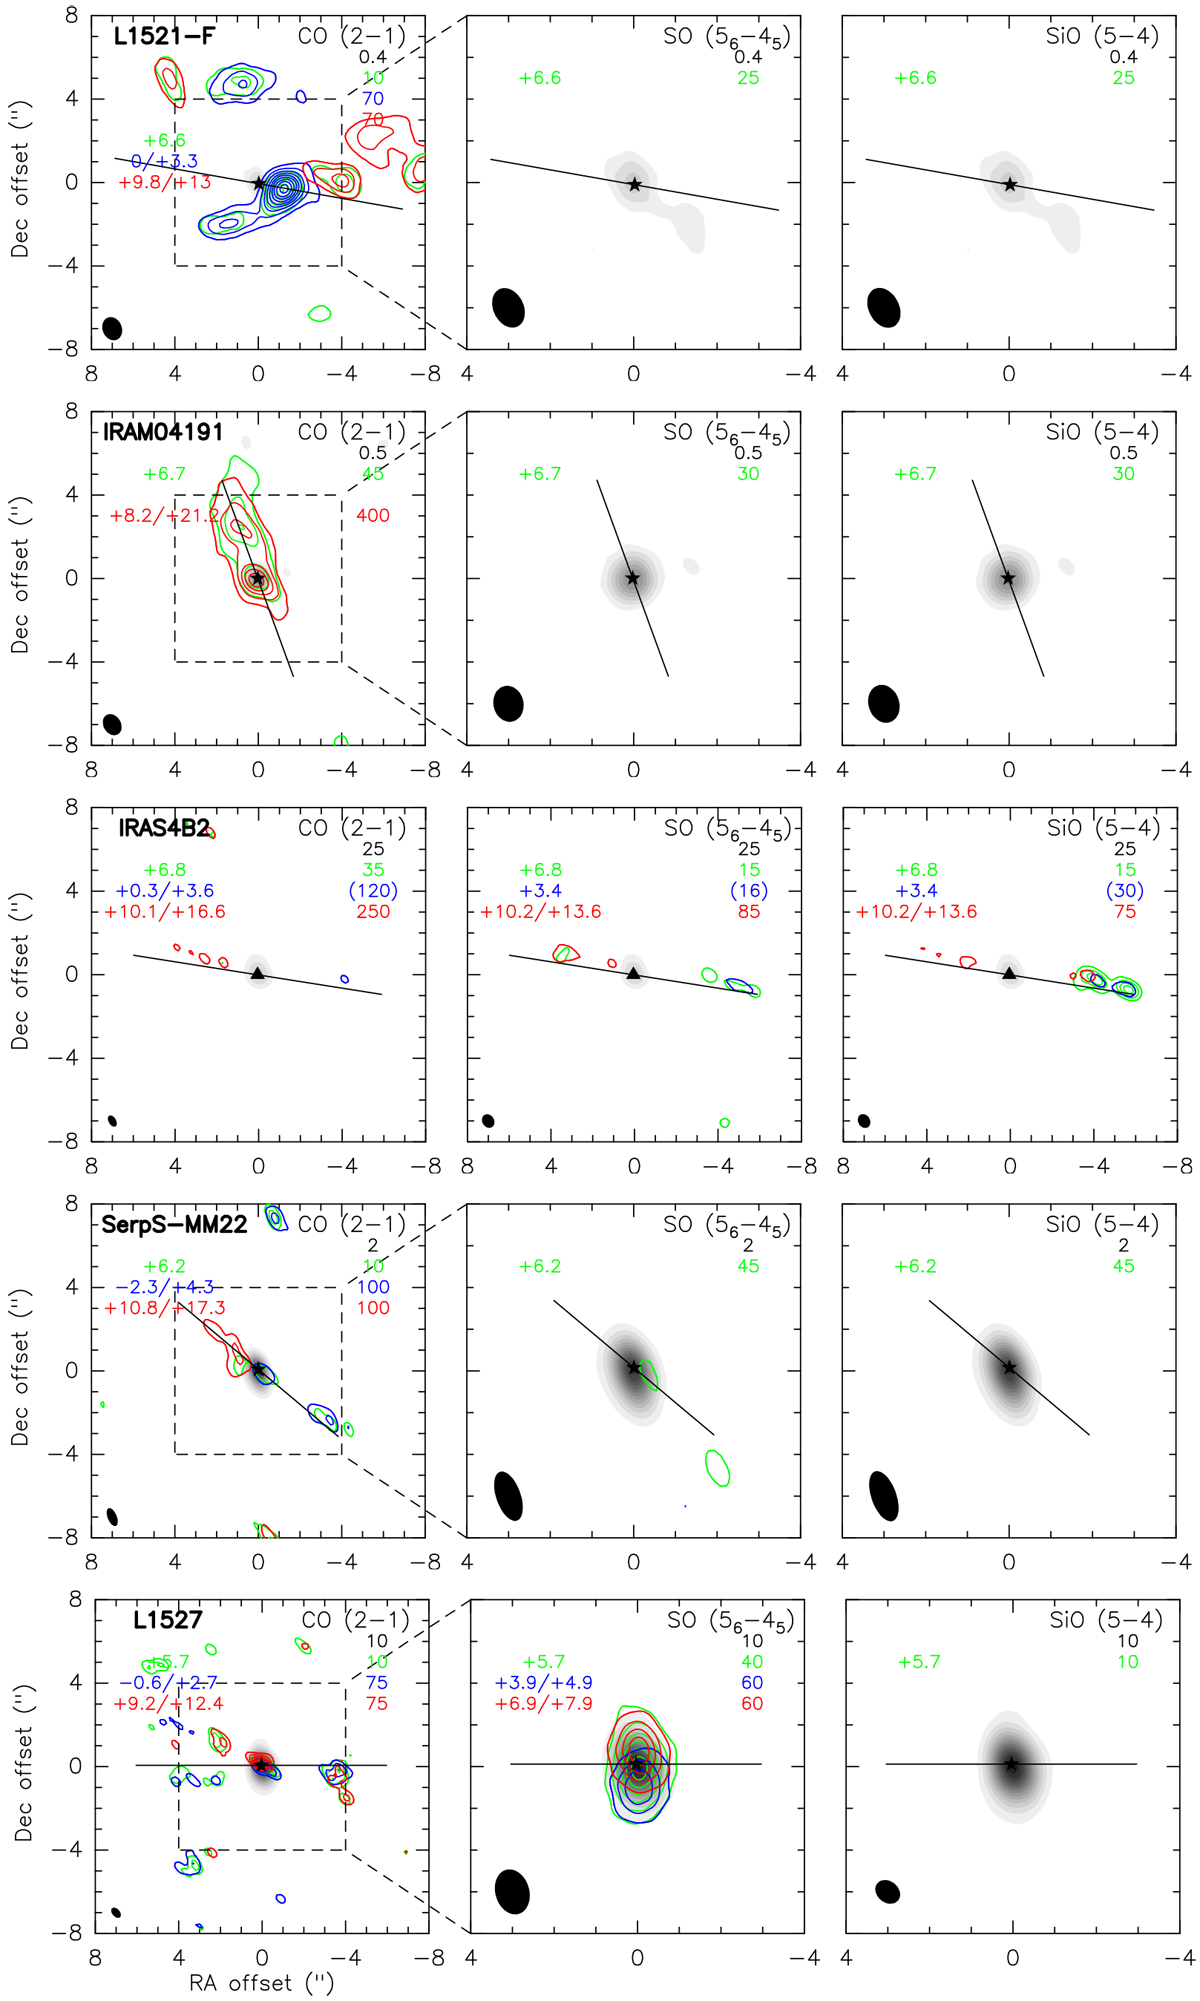
Integrated maps of the CO (2−1), SO (56 −45), and SiO (5−4) emission for the Class 0 protostars of the CALYPSO sample (left, center, and right panels). Continuum at 1.3 mm (grey scale) and integrated line emission at systemic, blue-, and red-shifted velocities (green, blue, and red contours) are shown. The systemic velocity (one channel) and the velocity of the first and last channels over which blue- and red-shifted emission was integrated (in km s−1) are labeled in the top-left corner (in green, blue, and red respectively). When the emission is detected on a single channel, its central velocity is labeled. The 5σ intensity of the corresponding integrated emission (in mJy km s−1 beam−1) is labeled in the top-right corners with the same colour coding. The 5σ intensity of the continuum (in mJy beam−1) is also labeled in black. The contours are from 5σ with steps of5σ. When the emission is faint the contours are from 3σ with steps of 3σ and the corresponding values are indicated in parentheses. The black stars (or triangles) indicate the positions of the protostars (or candidate protostars) identified by Maury et al. (2019), the black solid line shows the jet or outflow PA. The beam size is shown in the bottom-left corner.
Current usage metrics show cumulative count of Article Views (full-text article views including HTML views, PDF and ePub downloads, according to the available data) and Abstracts Views on Vision4Press platform.
Data correspond to usage on the plateform after 2015. The current usage metrics is available 48-96 hours after online publication and is updated daily on week days.
Initial download of the metrics may take a while.