Fig. 9
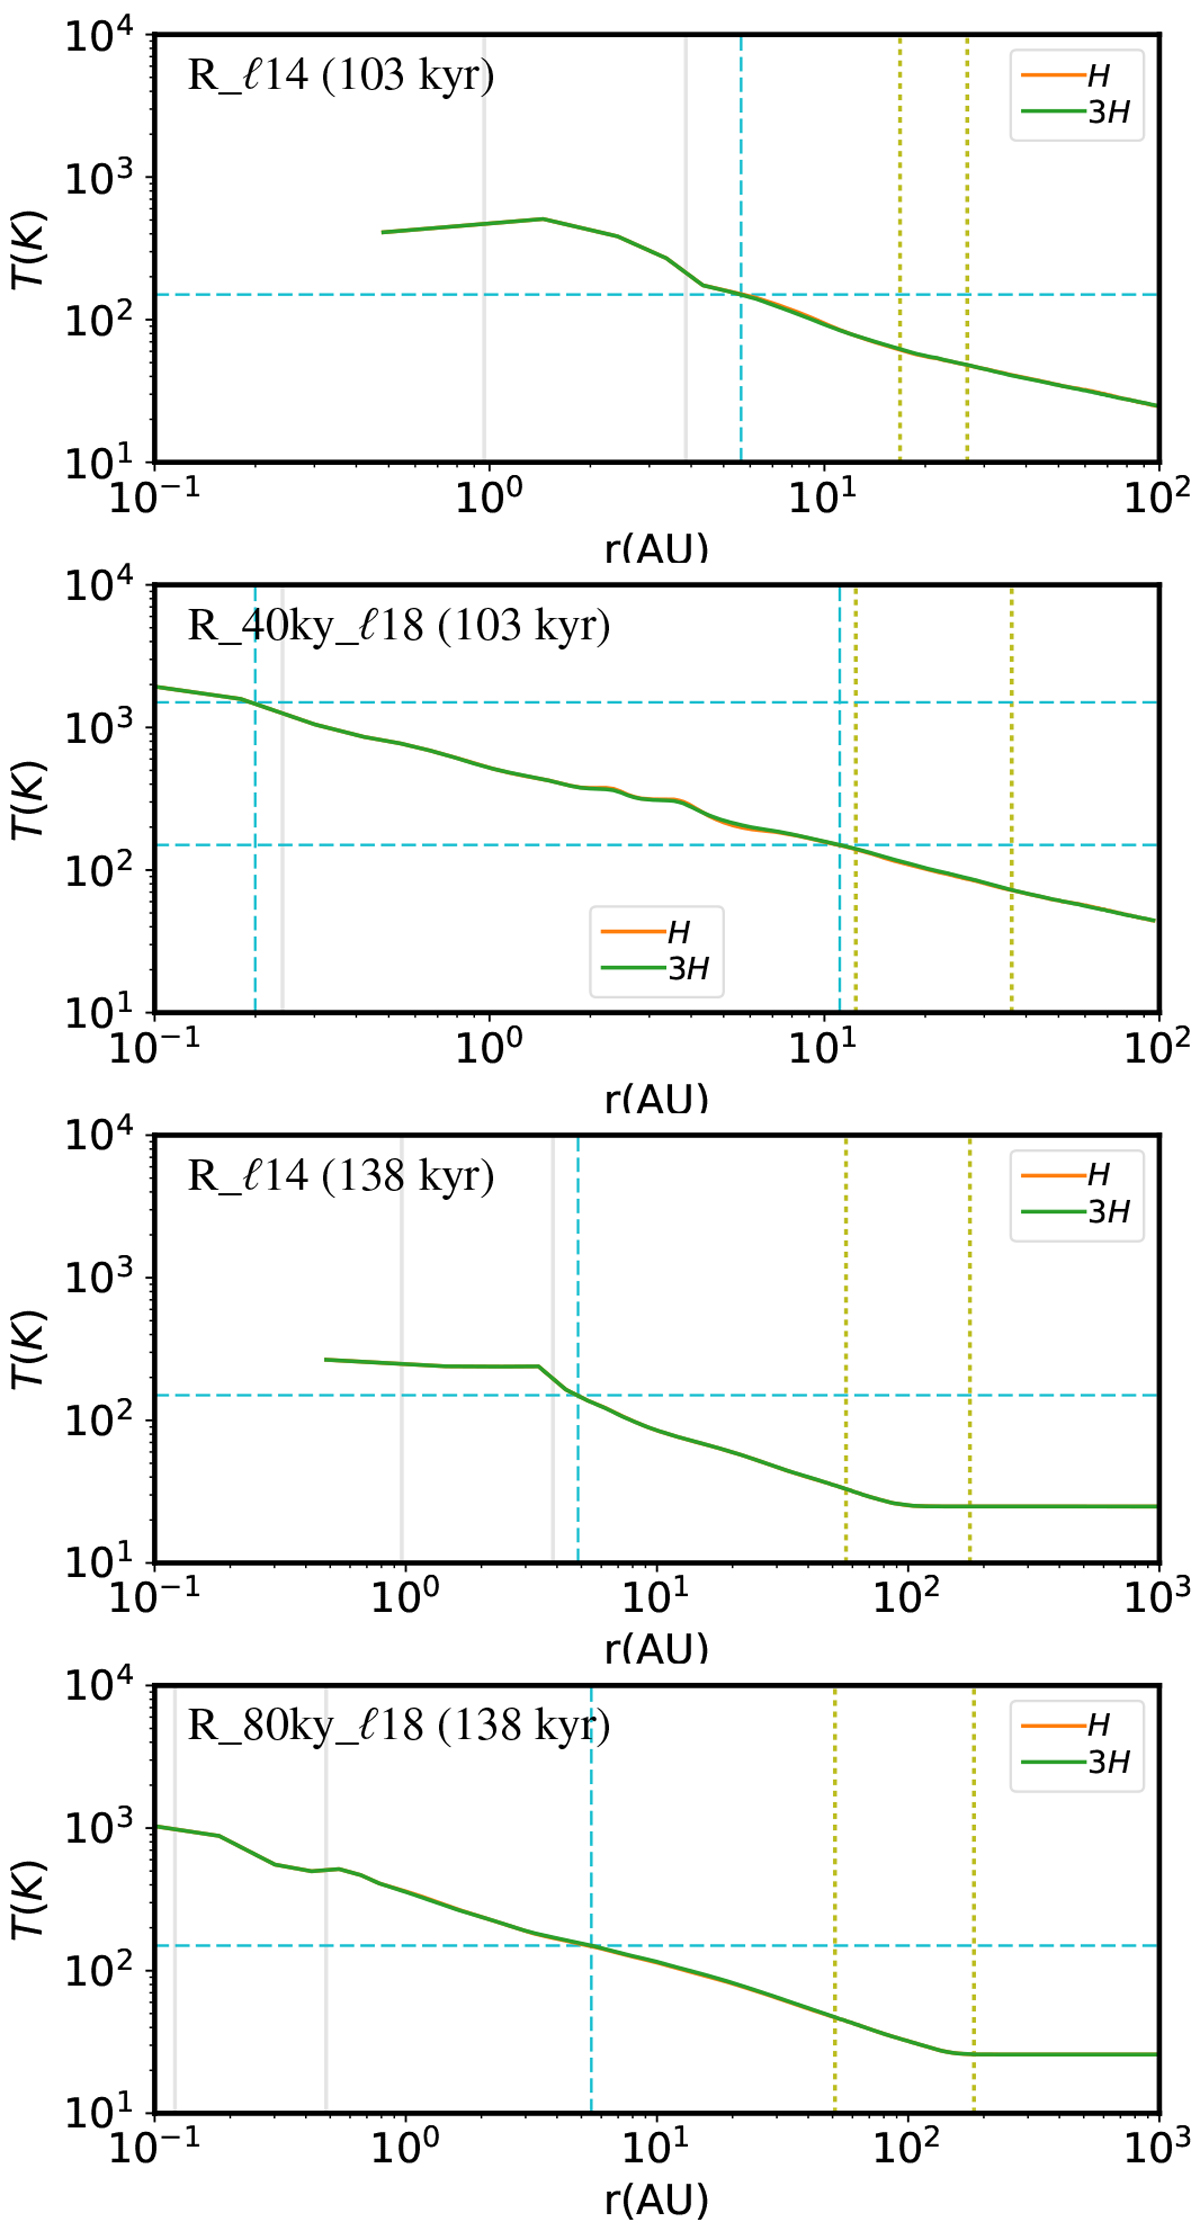
Radial temperature profiles of the disk. The same snapshots as in Fig. 4 are shown. The temperature is averaged (mass-weighted) vertically within H (orange) and3H (green). The snow-line (R150) and the CAI condensation line (R1500, if present) are marked with vertical dashed cyan lines. In the low-resolution run, the snow-line R150 is very close to the resolution limit and thus not well resolved. High-resolution restarts are indeed necessary to study the interior structure of the disk correctly. The CAI condensation line R1500 appears in R_40ky_ℓ18, while in R_80ky_ℓ18, this line hasmigrated inward due to the decreased overall density and temperature.
Current usage metrics show cumulative count of Article Views (full-text article views including HTML views, PDF and ePub downloads, according to the available data) and Abstracts Views on Vision4Press platform.
Data correspond to usage on the plateform after 2015. The current usage metrics is available 48-96 hours after online publication and is updated daily on week days.
Initial download of the metrics may take a while.