Fig. 5
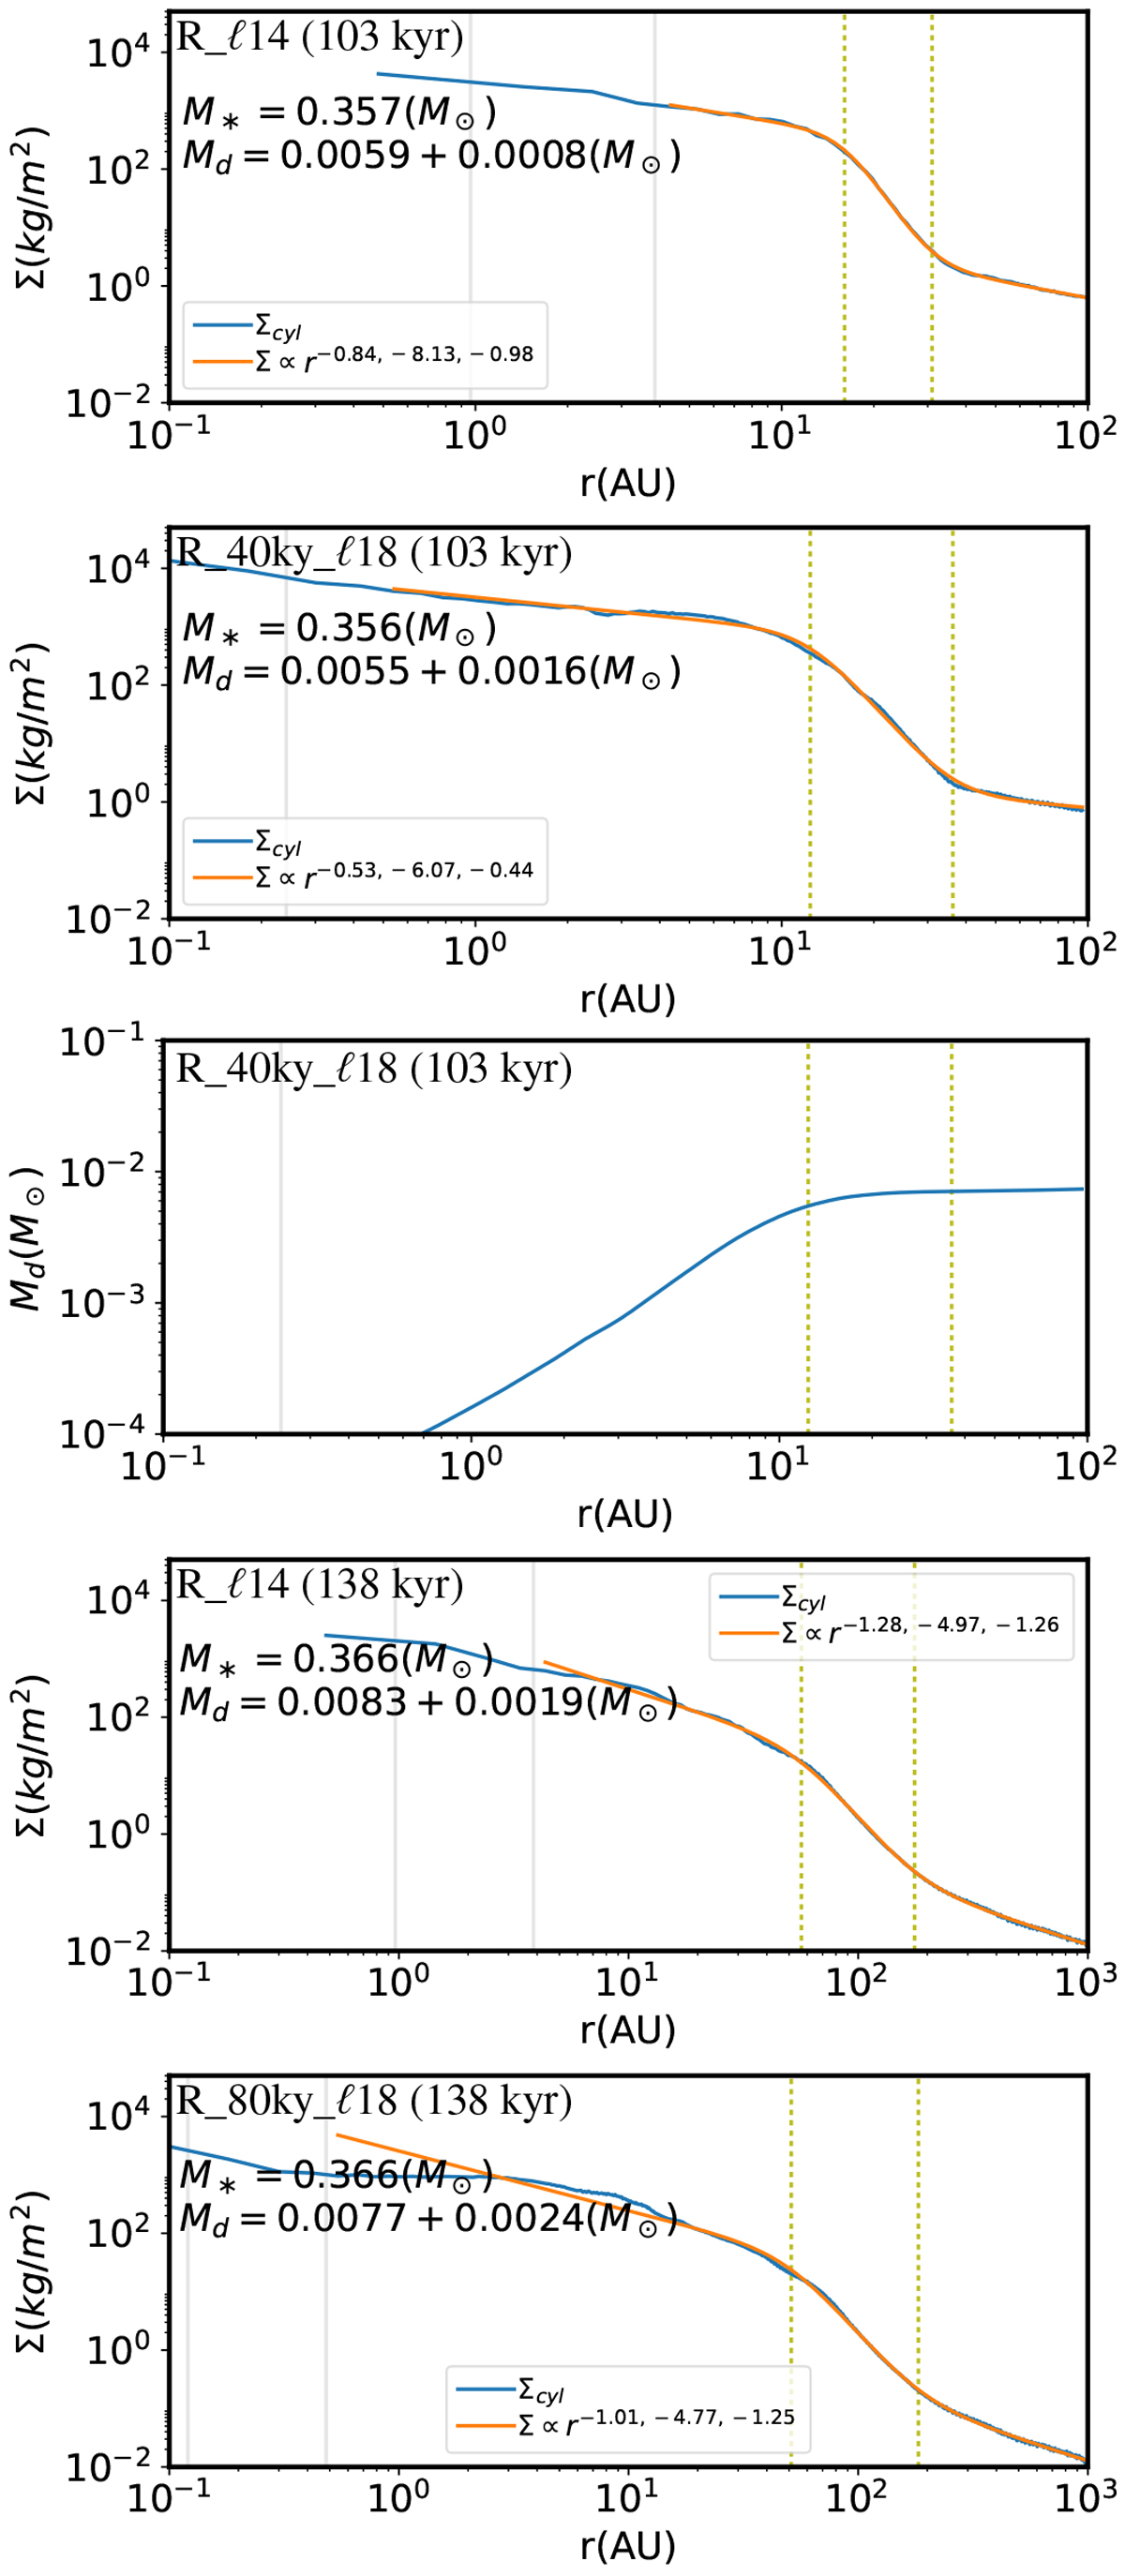
Disk surface density profile Σcyl(r) measured inside a selected cylindrical region (blue). Top two panels: R_ℓ14 and R_40ky_ℓ18 at 103 kyr. Middle: radially accumulated mass of the disk of R_40ky_ℓ18 at 103 kyr. Bottom two panels: R_ℓ14 and R_80ky_ℓ18 at 138kyr. A three-segment power-law fit is overplotted (orange), and the power-law exponentsare shown in the legend. Two vertical dotted lines show the characteristic radii Rkep and Rmag that correspond to the transition of the power-law slope. The masses of the star M* and of the disk Md (inside Rkep plus betweenRkep and Rmag) are also displayed. Most of the disk mass is contained within Rkep.
Current usage metrics show cumulative count of Article Views (full-text article views including HTML views, PDF and ePub downloads, according to the available data) and Abstracts Views on Vision4Press platform.
Data correspond to usage on the plateform after 2015. The current usage metrics is available 48-96 hours after online publication and is updated daily on week days.
Initial download of the metrics may take a while.