Fig. B.1
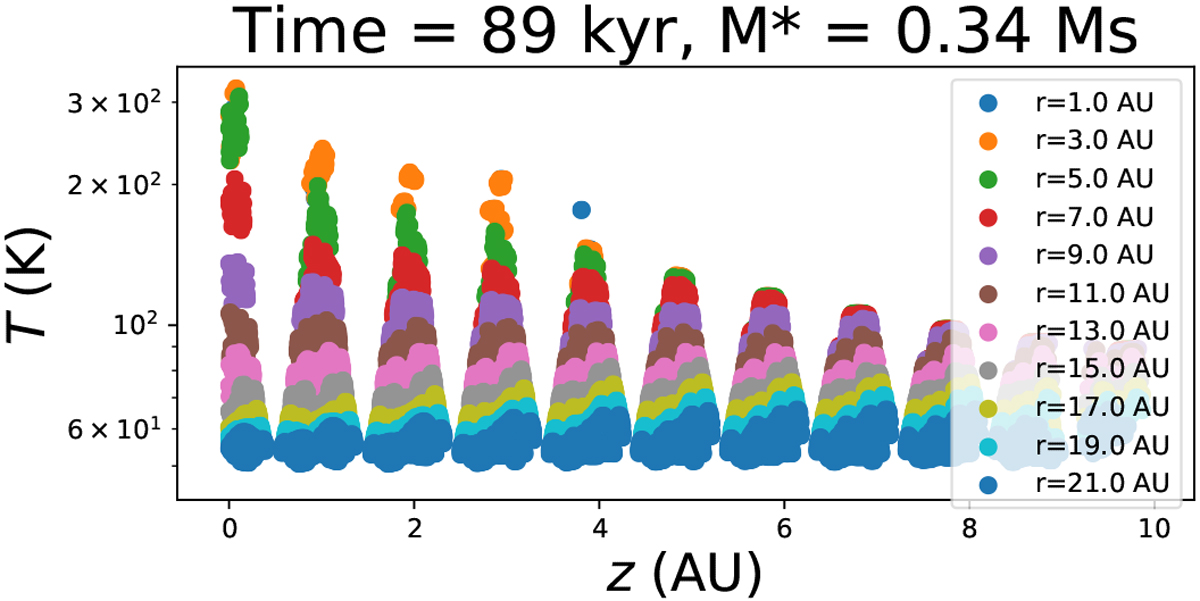
Temperature plotted against altitude, z, at various distance to the central star, r, from R_ℓ14 (the disk aspect ratio is ~0.1 (Sect. 5.1.1). Every dot corresponds to one cell in the simulation, without any averaging. The discrete distribution comes from the slight difference between the grid direction and the selected disk axis.
Current usage metrics show cumulative count of Article Views (full-text article views including HTML views, PDF and ePub downloads, according to the available data) and Abstracts Views on Vision4Press platform.
Data correspond to usage on the plateform after 2015. The current usage metrics is available 48-96 hours after online publication and is updated daily on week days.
Initial download of the metrics may take a while.