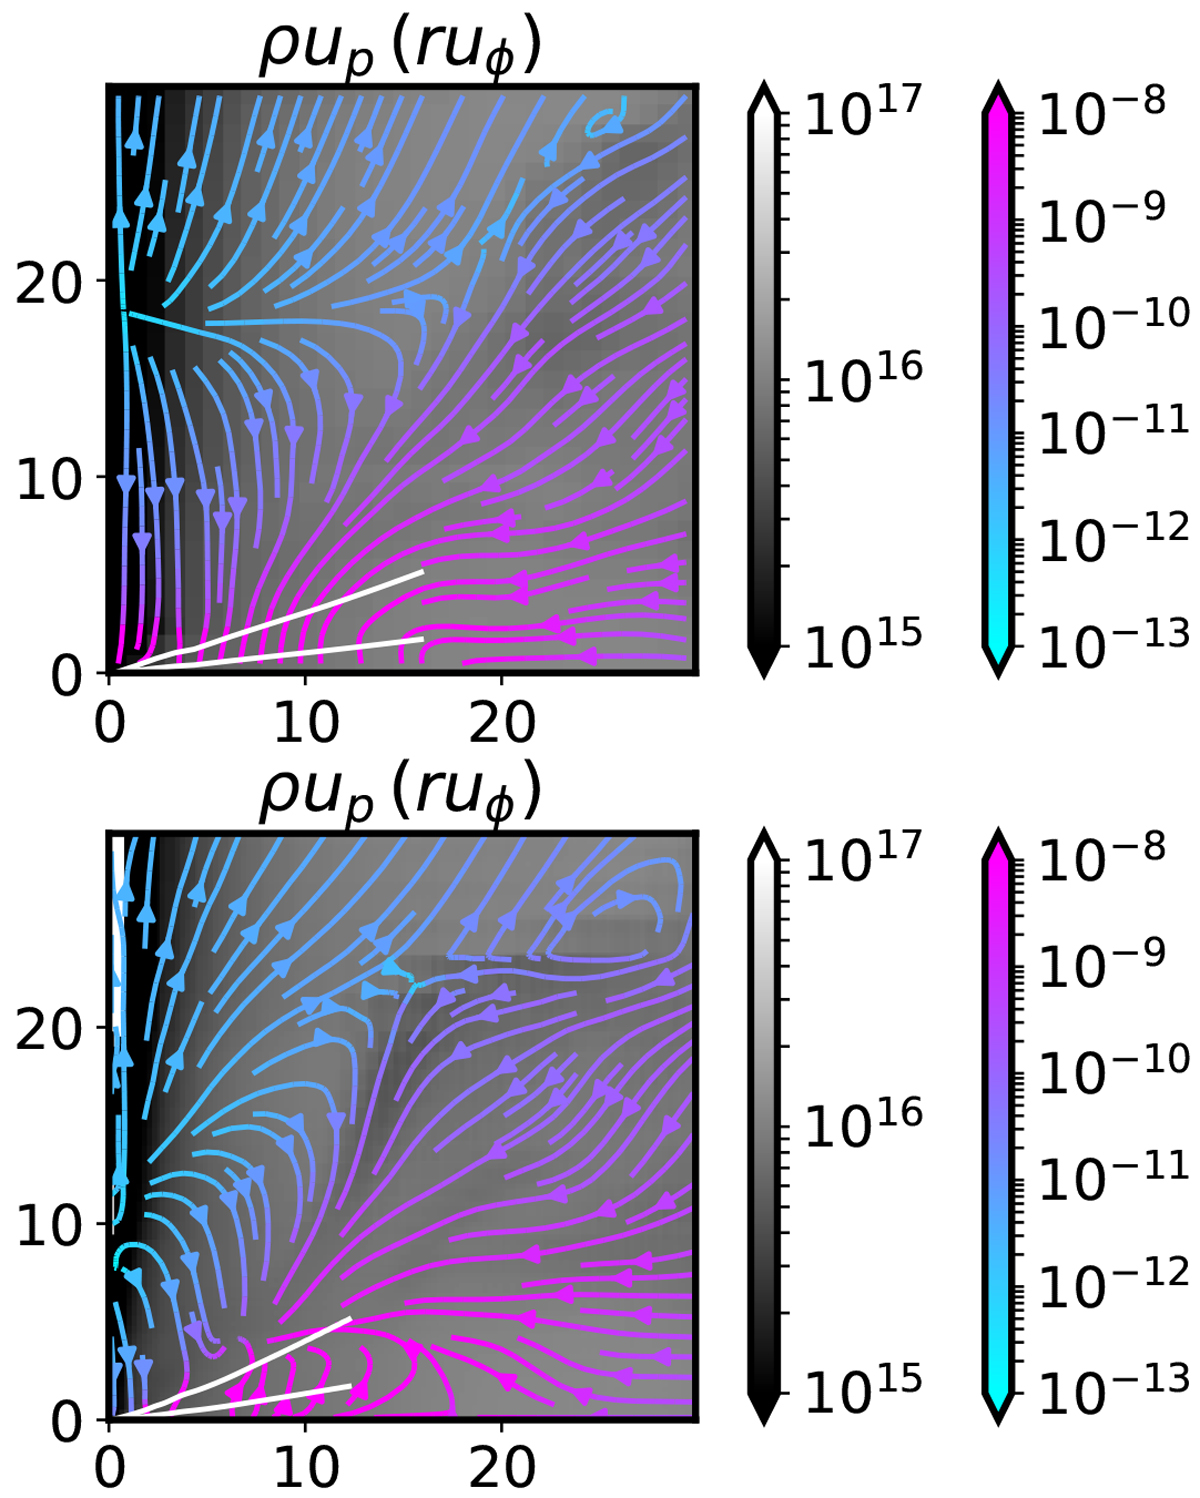
Fig. 19
Poloidal mass flux (![]() ) and specific angular momentum (
) and specific angular momentum (![]() ) around the disk region (color streamlines in the gray image, in SI units), for R_ℓ14 (top) and R_40ky_ℓ18 (bottom)at simulation time 103 kyr. All quantities are azimuthally averaged and averaged between the upper and lower planes. White curves outline the disk scale height
H
and 3H
at r < Rkep. An outflow is launched at high altitudes at z ≈ 20 AU in R_ℓ14. In the high-resolution run, the flow varies slightly more, but it is qualitatively similar. The outflow is launched closer to the disk (z ≈ 10 AU) and the disk size is slightly smaller. The outflow has relatively low density and manifestsitself as a cavity. Significant infall from the envelope is channeled through a zoneof low angular momentum at several scale heights (darker gray region near
z ≈ r) of the disk. The horizontal infall from the envelope reaches the outer edge of the disk (shown in Fig. 2 at
r ≈ 15 AU), and thedensity contrast generates a shock that pushes the gas to higher altitude. This creates a counterclockwise poloidal circulation near the disk edge between 10 and 15 AU in R_40ky_ℓ18 because the outer disk decretes at this instant, while it is not seen in the upper panel.
) around the disk region (color streamlines in the gray image, in SI units), for R_ℓ14 (top) and R_40ky_ℓ18 (bottom)at simulation time 103 kyr. All quantities are azimuthally averaged and averaged between the upper and lower planes. White curves outline the disk scale height
H
and 3H
at r < Rkep. An outflow is launched at high altitudes at z ≈ 20 AU in R_ℓ14. In the high-resolution run, the flow varies slightly more, but it is qualitatively similar. The outflow is launched closer to the disk (z ≈ 10 AU) and the disk size is slightly smaller. The outflow has relatively low density and manifestsitself as a cavity. Significant infall from the envelope is channeled through a zoneof low angular momentum at several scale heights (darker gray region near
z ≈ r) of the disk. The horizontal infall from the envelope reaches the outer edge of the disk (shown in Fig. 2 at
r ≈ 15 AU), and thedensity contrast generates a shock that pushes the gas to higher altitude. This creates a counterclockwise poloidal circulation near the disk edge between 10 and 15 AU in R_40ky_ℓ18 because the outer disk decretes at this instant, while it is not seen in the upper panel.
Current usage metrics show cumulative count of Article Views (full-text article views including HTML views, PDF and ePub downloads, according to the available data) and Abstracts Views on Vision4Press platform.
Data correspond to usage on the plateform after 2015. The current usage metrics is available 48-96 hours after online publication and is updated daily on week days.
Initial download of the metrics may take a while.