Free Access
Fig. 14
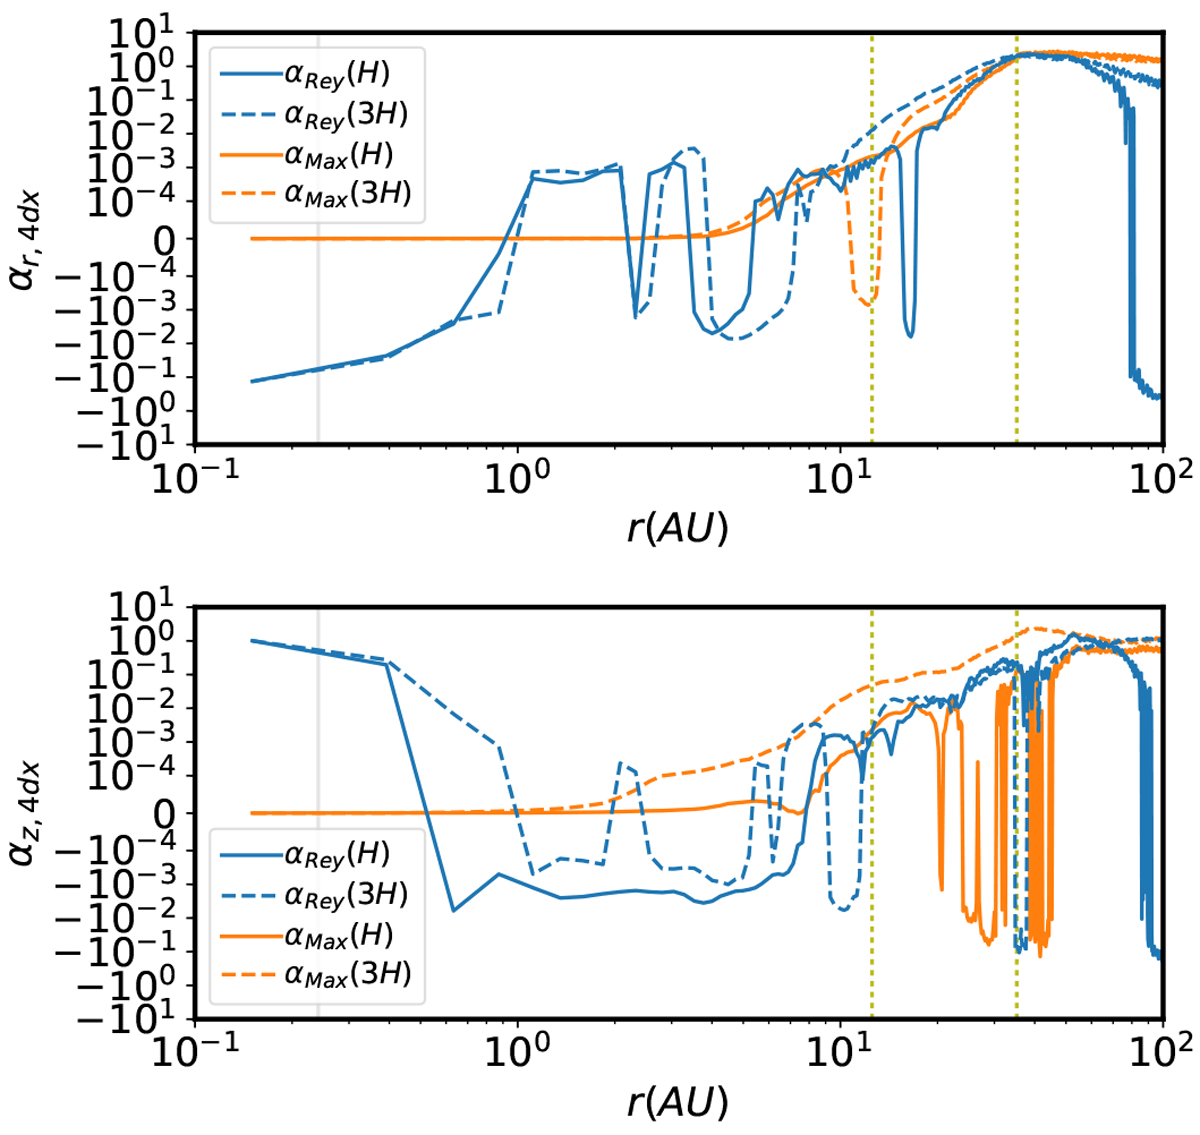
Disk α for R_40ky_ℓ18 at 103 kyr. Top panel: Reynolds and Maxwell stresses in r direction. Bottom panel: two components in z direction. Both positive and negative values with |α| > 10−4 are plotted in logarithmic scale, and this is connected by a linear range in between.
Current usage metrics show cumulative count of Article Views (full-text article views including HTML views, PDF and ePub downloads, according to the available data) and Abstracts Views on Vision4Press platform.
Data correspond to usage on the plateform after 2015. The current usage metrics is available 48-96 hours after online publication and is updated daily on week days.
Initial download of the metrics may take a while.