Fig. 12
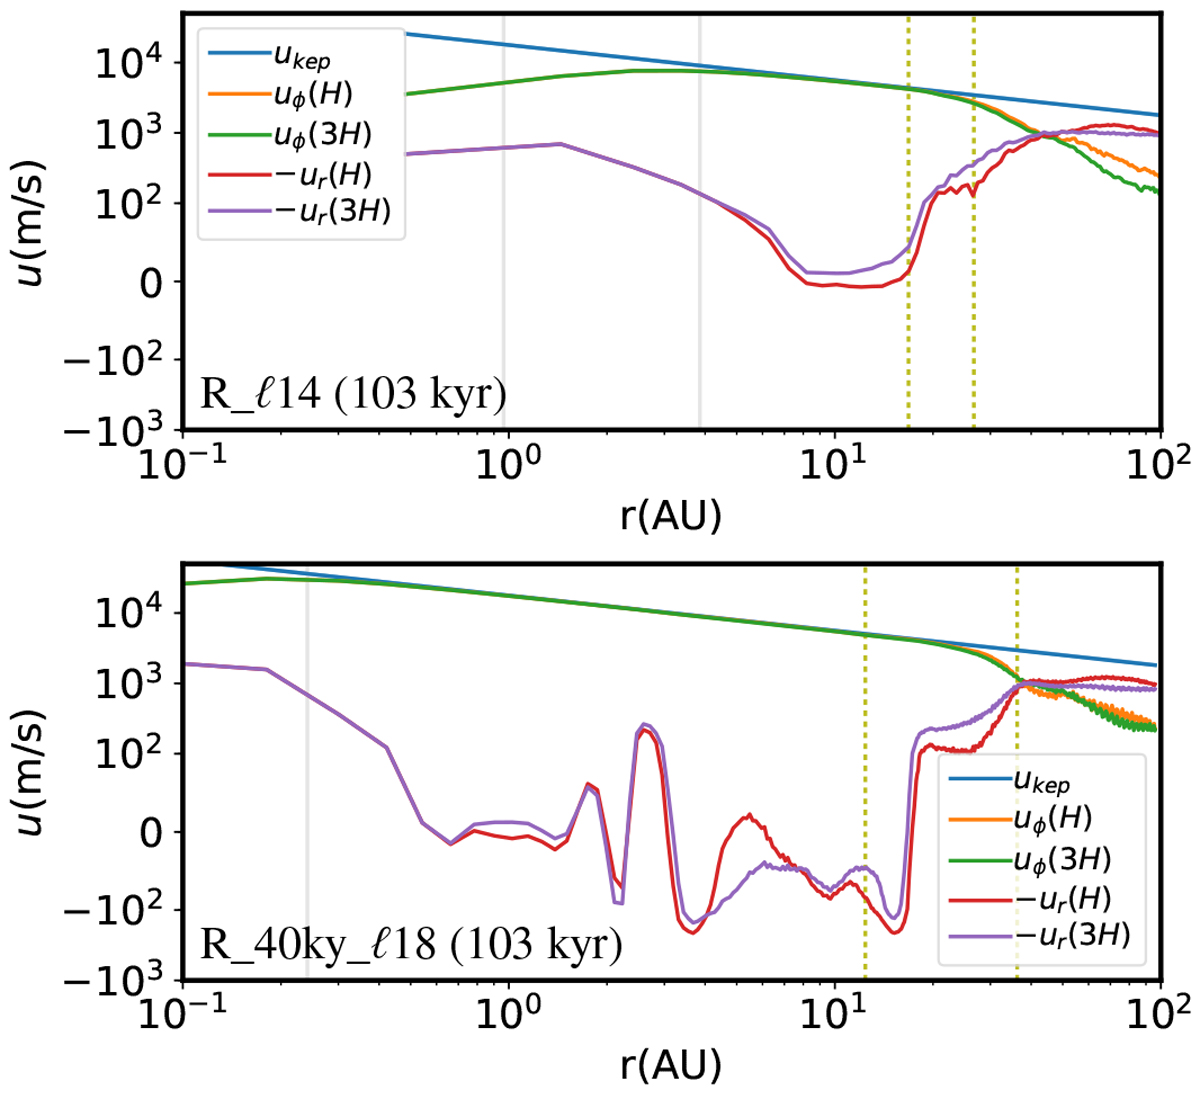
Velocity profiles of the disk at two resolutions: rotational velocity within H (orange) /3H (green) and infall velocity within H (red)/3H (violet). Both positive and negative values with |u| > 102 are plotted in logarithmic scale, and this is connected with a linear range in between. The Keplerian rotational velocity is plotted in blue for reference. The inner disk is very close to Keplerian rotation, and the deviation becomes remarkable in the outer magnetized part of the disk. The envelope is far from Keplerian rotation, while the infalling gas has roughly half the free-fall velocity. Below the disk accretion radius (vertical gray line), the velocity is not physically meaningful. The disk characteristic radii Rkep and Rmag (the dotted vertical lines) mark the transition between different behaviors.
Current usage metrics show cumulative count of Article Views (full-text article views including HTML views, PDF and ePub downloads, according to the available data) and Abstracts Views on Vision4Press platform.
Data correspond to usage on the plateform after 2015. The current usage metrics is available 48-96 hours after online publication and is updated daily on week days.
Initial download of the metrics may take a while.