Fig. 8.
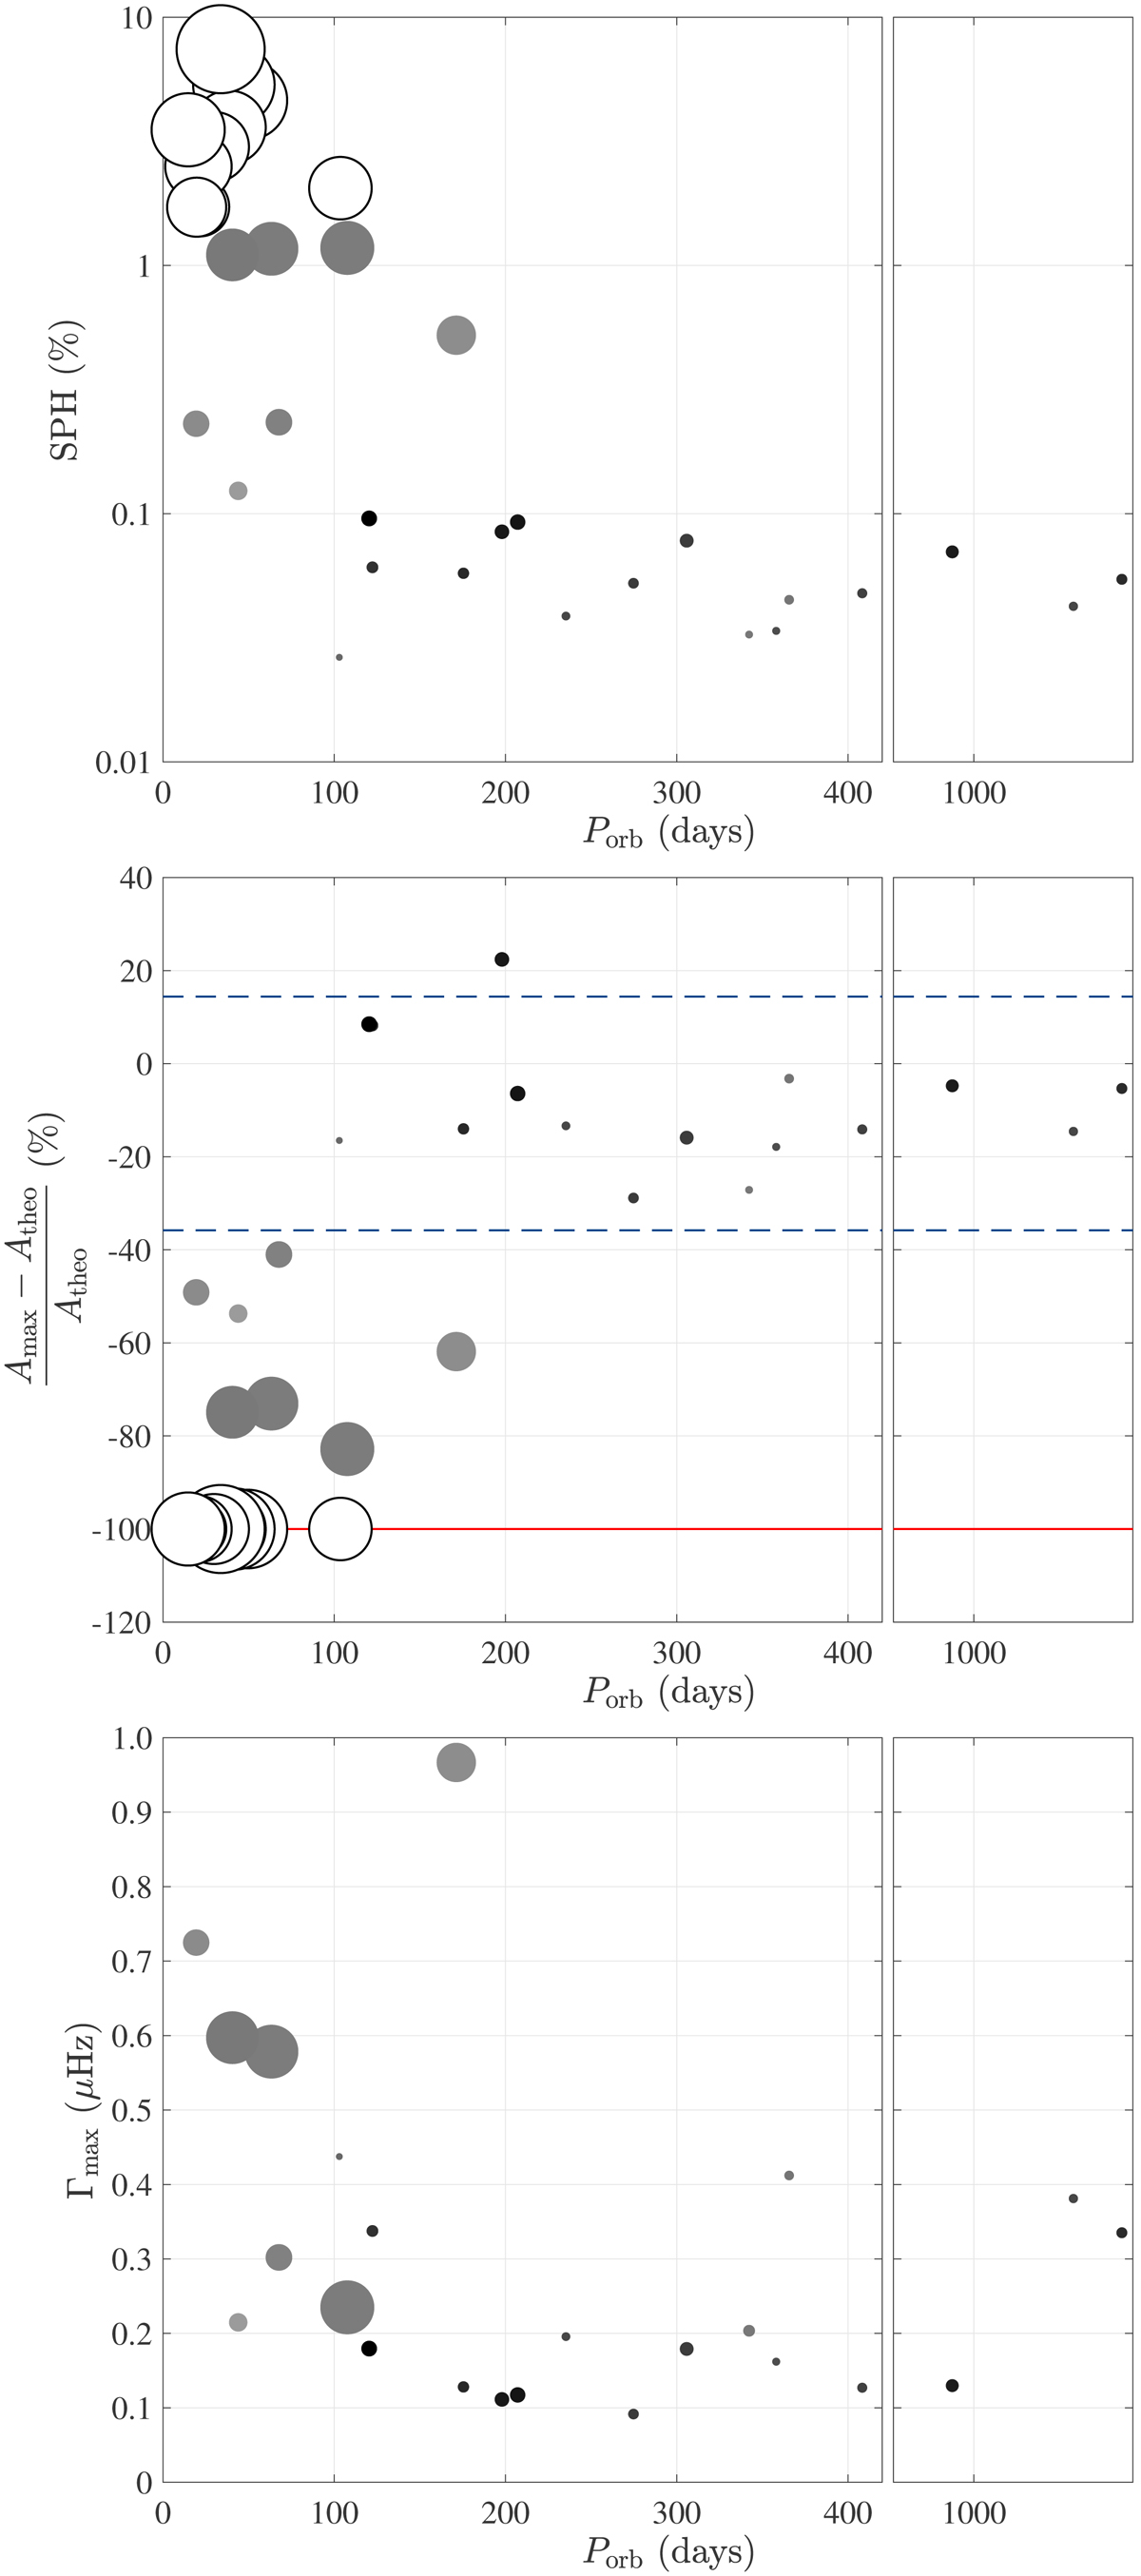
Properties of rotational modulations and radial (l = 0) modes near the frequency at maximum amplitude νmax. Top panel: photometric magnetic activity level proxy Sph (%) as a function of orbital period (days). The Sph values are given in Tables B.1 and 4. Middle panel: relative difference in between expected and measured oscillation amplitudes (%) as a function of orbital period Porb (days). The red line indicates 0, i.e., stars whose oscillations are not detected. The two dashed blue lines represent the region in which relative mode amplitude lies for systems with orbital periods longer than 180 days within two sigma. Bottom panel: mode width Γmax (μHz) as a function of orbital period Porb (d). In all panels the size of each symbol represents the amplitude of stellar variability Sph and the gray scale indicates the pulsation mode amplitude (white-no modes; black-large amp.).
Current usage metrics show cumulative count of Article Views (full-text article views including HTML views, PDF and ePub downloads, according to the available data) and Abstracts Views on Vision4Press platform.
Data correspond to usage on the plateform after 2015. The current usage metrics is available 48-96 hours after online publication and is updated daily on week days.
Initial download of the metrics may take a while.