Fig. 10.
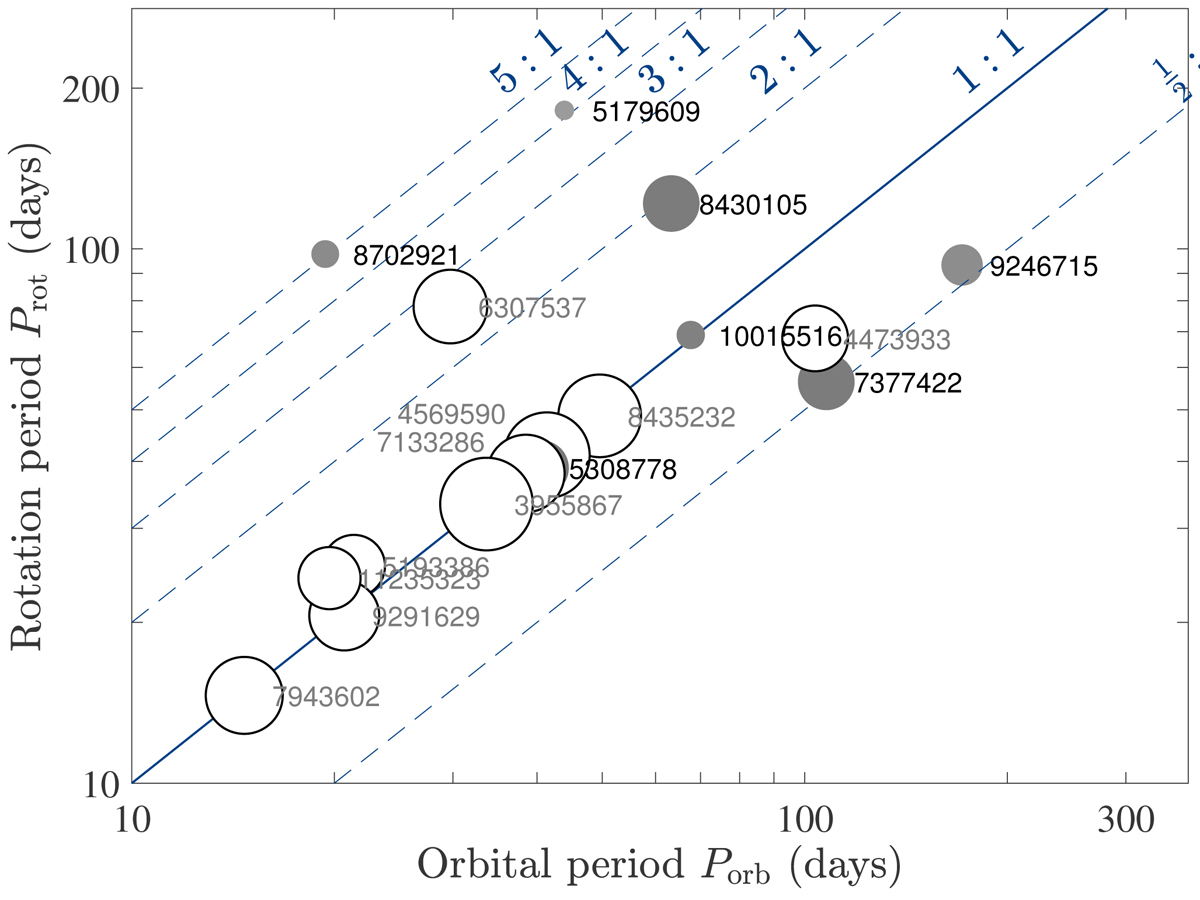
Orbital period vs. the rotation period for the 17 systems (out of the set 35 RG/EBs studied by Gaulme et al. 2014 and this paper), where significant surface activity is detected. The size of each symbol represents the amplitude of stellar variability and the gray scale indicates the pulsation-mode amplitude (white–no modes; black–large amp). The parallel lines indicate isolevels of the ratio Prot/Porb. This figure is an updated version of Fig. 5 from Gaulme et al. (2014).
Current usage metrics show cumulative count of Article Views (full-text article views including HTML views, PDF and ePub downloads, according to the available data) and Abstracts Views on Vision4Press platform.
Data correspond to usage on the plateform after 2015. The current usage metrics is available 48-96 hours after online publication and is updated daily on week days.
Initial download of the metrics may take a while.